Will you then write a blog post or a message here explaining what you did?
I asked him last year what his exact portfolio is. He said 100% DFA607: https://ca.dimensional.com/en/funds/global-equity-portfolio-f
I see no factor tilts there.
1 Like
Just keep in mind that he mentions canadian based ETFs with an extra home bias.
It is just a fund of funds with the following funds:
| Fund | Allocation |
|---|---|
| DFA U.S. Core Equity Fund | 26.54% |
| DFA Canadian Core Equity Fund | 22.17% |
| DFA International Core Equity Fund | 18.15% |
| DFA U.S. Vector Equity Fund | 11.54% |
| DFA Canadian Vector Equity Fund | 9.67% |
| DFA International Vector Equity Fund | 7.83% |
| DFA Global Real Estate Securities Fund | 3.87% |
So nearly 30% is in DFAs Vecor funds that have a small cap value tilt. However, the tilt is not quite as big as with the SCV funds from Avantis.
2 Likes
When I watch his videos about factor investing, I can’t wrap my head around it. The general concept is: via a selection of publicly available metrics, it is possible to isolate a “risk factor”, that is rewarded with higher return. But already this definition is so vague that it falls apart in my head.
So for example, there is the size factor. Smaller stocks are undervalued and tend to outperform larger stocks. But if this fact is well known, and if enough people make use of it, then wouldn’t we eventually see small stocks raise in price enough to close this inefficiency gap?
The same goes for other factors. For some reason, the market undervalues stocks with high value, quality, momentum. This sounds counter-intuitive. Why would quality stocks be undervalued by the market? But even if it is like that, once enough capital invests accordingly, all these inefficiencies should be gone, and they would be no better than total market index.
So do these inefficiencies persist, because not enough investors make use of the factors? Or is it that all factors come with extra “risk”, so the market correctly puts the price lower. In other words: factor investing comes with more risk. But since the factors are uncorrelated, they cancel each other out and your end risk is smaller?
And finally, what is risk when it comes to index funds? I can understand risk in case of a single investment. You risk that the company goes bankrupt. But for the whole market? The way I interpret risk is “the probability that your investment underperforms beyond your investment horizon” (i.e. for longer than you plan to stay in the market).
This is what he is saying basically.
But he also made clear in an earlier video that you have to be prepared to underperform the market for 10, 15 or even 20 years. So this tracking error risk is something not many are able to endure.
AFAIK those are based on the Fama-French model which is an extension of CAPM.
One thing I don’t clearly understand is once you have this model, how to you find the efficient frontier. Is any split of portfolio in the efficient frontier? Or only some of them? Is it the “hard” part that you can’t actually measure/predict the variables (you know the portfolio is decomposed in this way, but the variables are just a guesswork similar to the risk parity portfolio?)
(FWIW I think risk parity is more advanced/sound in term of portfolio theory, tho likely harder to setup in practice, especially for DIY investors)
See the proposed portfolio at https://youtu.be/jKWbW7Wgm0w?t=805 I see no candian home bias in there.
XIC is Canada only and it’s 30% of the portfolio…
1 Like
Ah yeah, just realized 4 out of the 6 positions are CAD traded…
I came to that conclusion when I read his example portfolios on their rational reminder website a while ago 
So if you invest in VT, you invest in an unclear mix of various short/long term strategies and asset “subclasses”, right? Unclear, because you don’t really know what is the average investment horizon of the entire market. In a bear market, probably many short-term investors evacuate and don’t come back until things “settle down”, so the average investing horizon of the survivors increases.
Then if you isolate one subclass, like “small caps”, you can observe that it has a favorable return distribution relative to the total market. Let’s say the total market return is described with a bell curve of (ev=10%, std=5%, red) and small caps are (ev=11%, std=6%, blue):
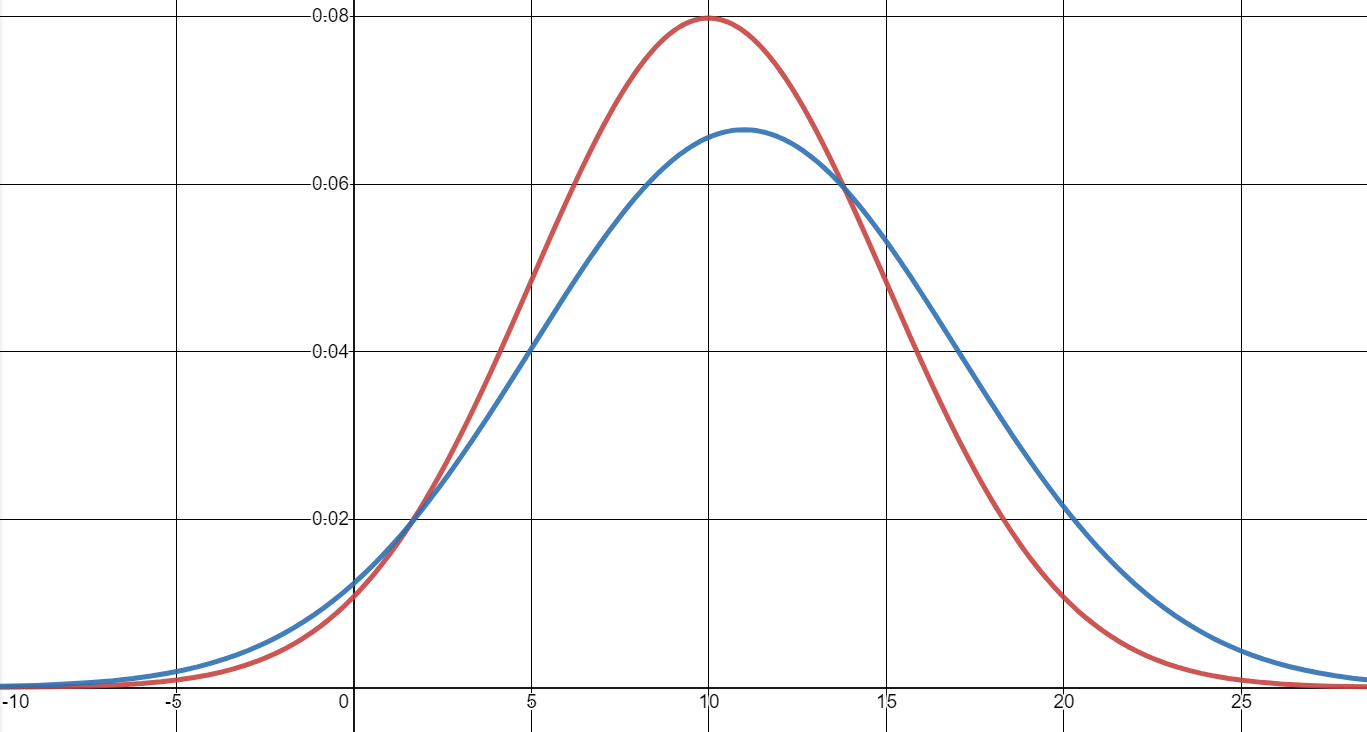
You have a higher chance of hitting annual returns over 15% but also under 0% (that would be the long tail) because of the higher volatility. But since other factors that you invest in are uncorrelated, your effective standard deviation is again reduced, but the higher expected value stays. Correct?
Here is a pdf that describes their approach to investing:
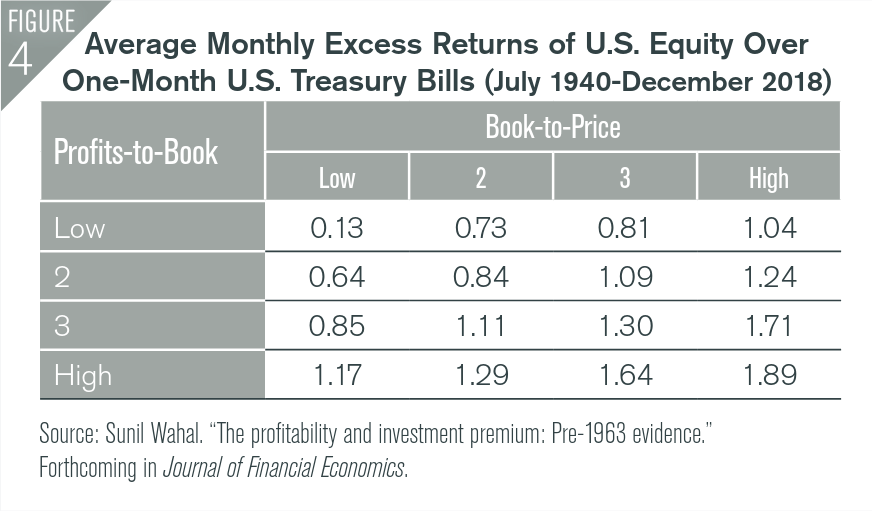
The average monthly excess return for value and profitability is quite big: