Hey everyone, creating an export to PP is a really good idea. I am currently exporting my beancount to influxdb and visualizing with Grafana. Unfortunately, I am not handling equities well with Grafana yet, but I had plans to re-create some of the PP views into Grafana but obtaining the portfolio from beancount.
One thing that is annoying me is that I did not find a good way to read beancount data without first exporting to CSV and then reading the CSV. If you are doing it in some way that does not need to first export to CSV, please share 
In case it helps this is how I am currently the generating the CSV on my script which I then read and export to influxdb:
from beancount.utils import misc_utils
from beancount import loader
from beancount.query import shell
from beancount.parser import version

import csv
import sys

# A function that the beancount.query shell module needs
def load():
    # sorry, config is defined elsewhere in my code, you want to put the path to your main beancount file here.
	beanfile = config.fi_path+config.bean_path
	errors_file = sys.stderr
	with misc_utils.log_time('beancount.loader (total)', logging.info):
		return loader.load_file(beanfile,
    							log_timings=logging.info,
    							log_errors=errors_file)

def bean_query_to_csv(outfile,query):
    """
    outfile - path of the CSV file to write
    query - a beanquery string, i.e: "SELECT date, account, sum(number) as Total, currency FROM year WHERE account ~ 'Income' GROUP BY date, account, currency ORDER BY date, currency"
    """
	with open(outfile, 'w', encoding='utf-8') as csvfile:
		shell_obj = shell.BQLShell(False, load, csvfile, 'csv')
		shell_obj.on_Reload()
		shell_obj.default(query)
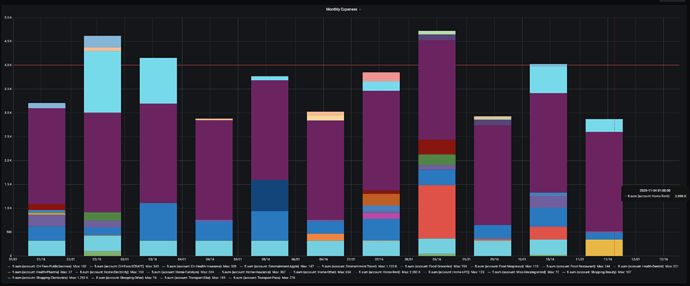
As an example, this is how the expenses graph exported looks like in Grafana:
I filtered taxes out of this graph so I can control what I am spending money on every month. Goal is to keep it lower than 4k for the moment.
I made some other graphs to track other things, like saving rates and income but I keep changing the graphs as I don’t know yet what is really useful 
What financial metrics do you track every month? I am taking ideas on what to implement with Grafana 


