does anyone have/ use a plugin to distritubute costs/ incomes over a specified time and frequency?
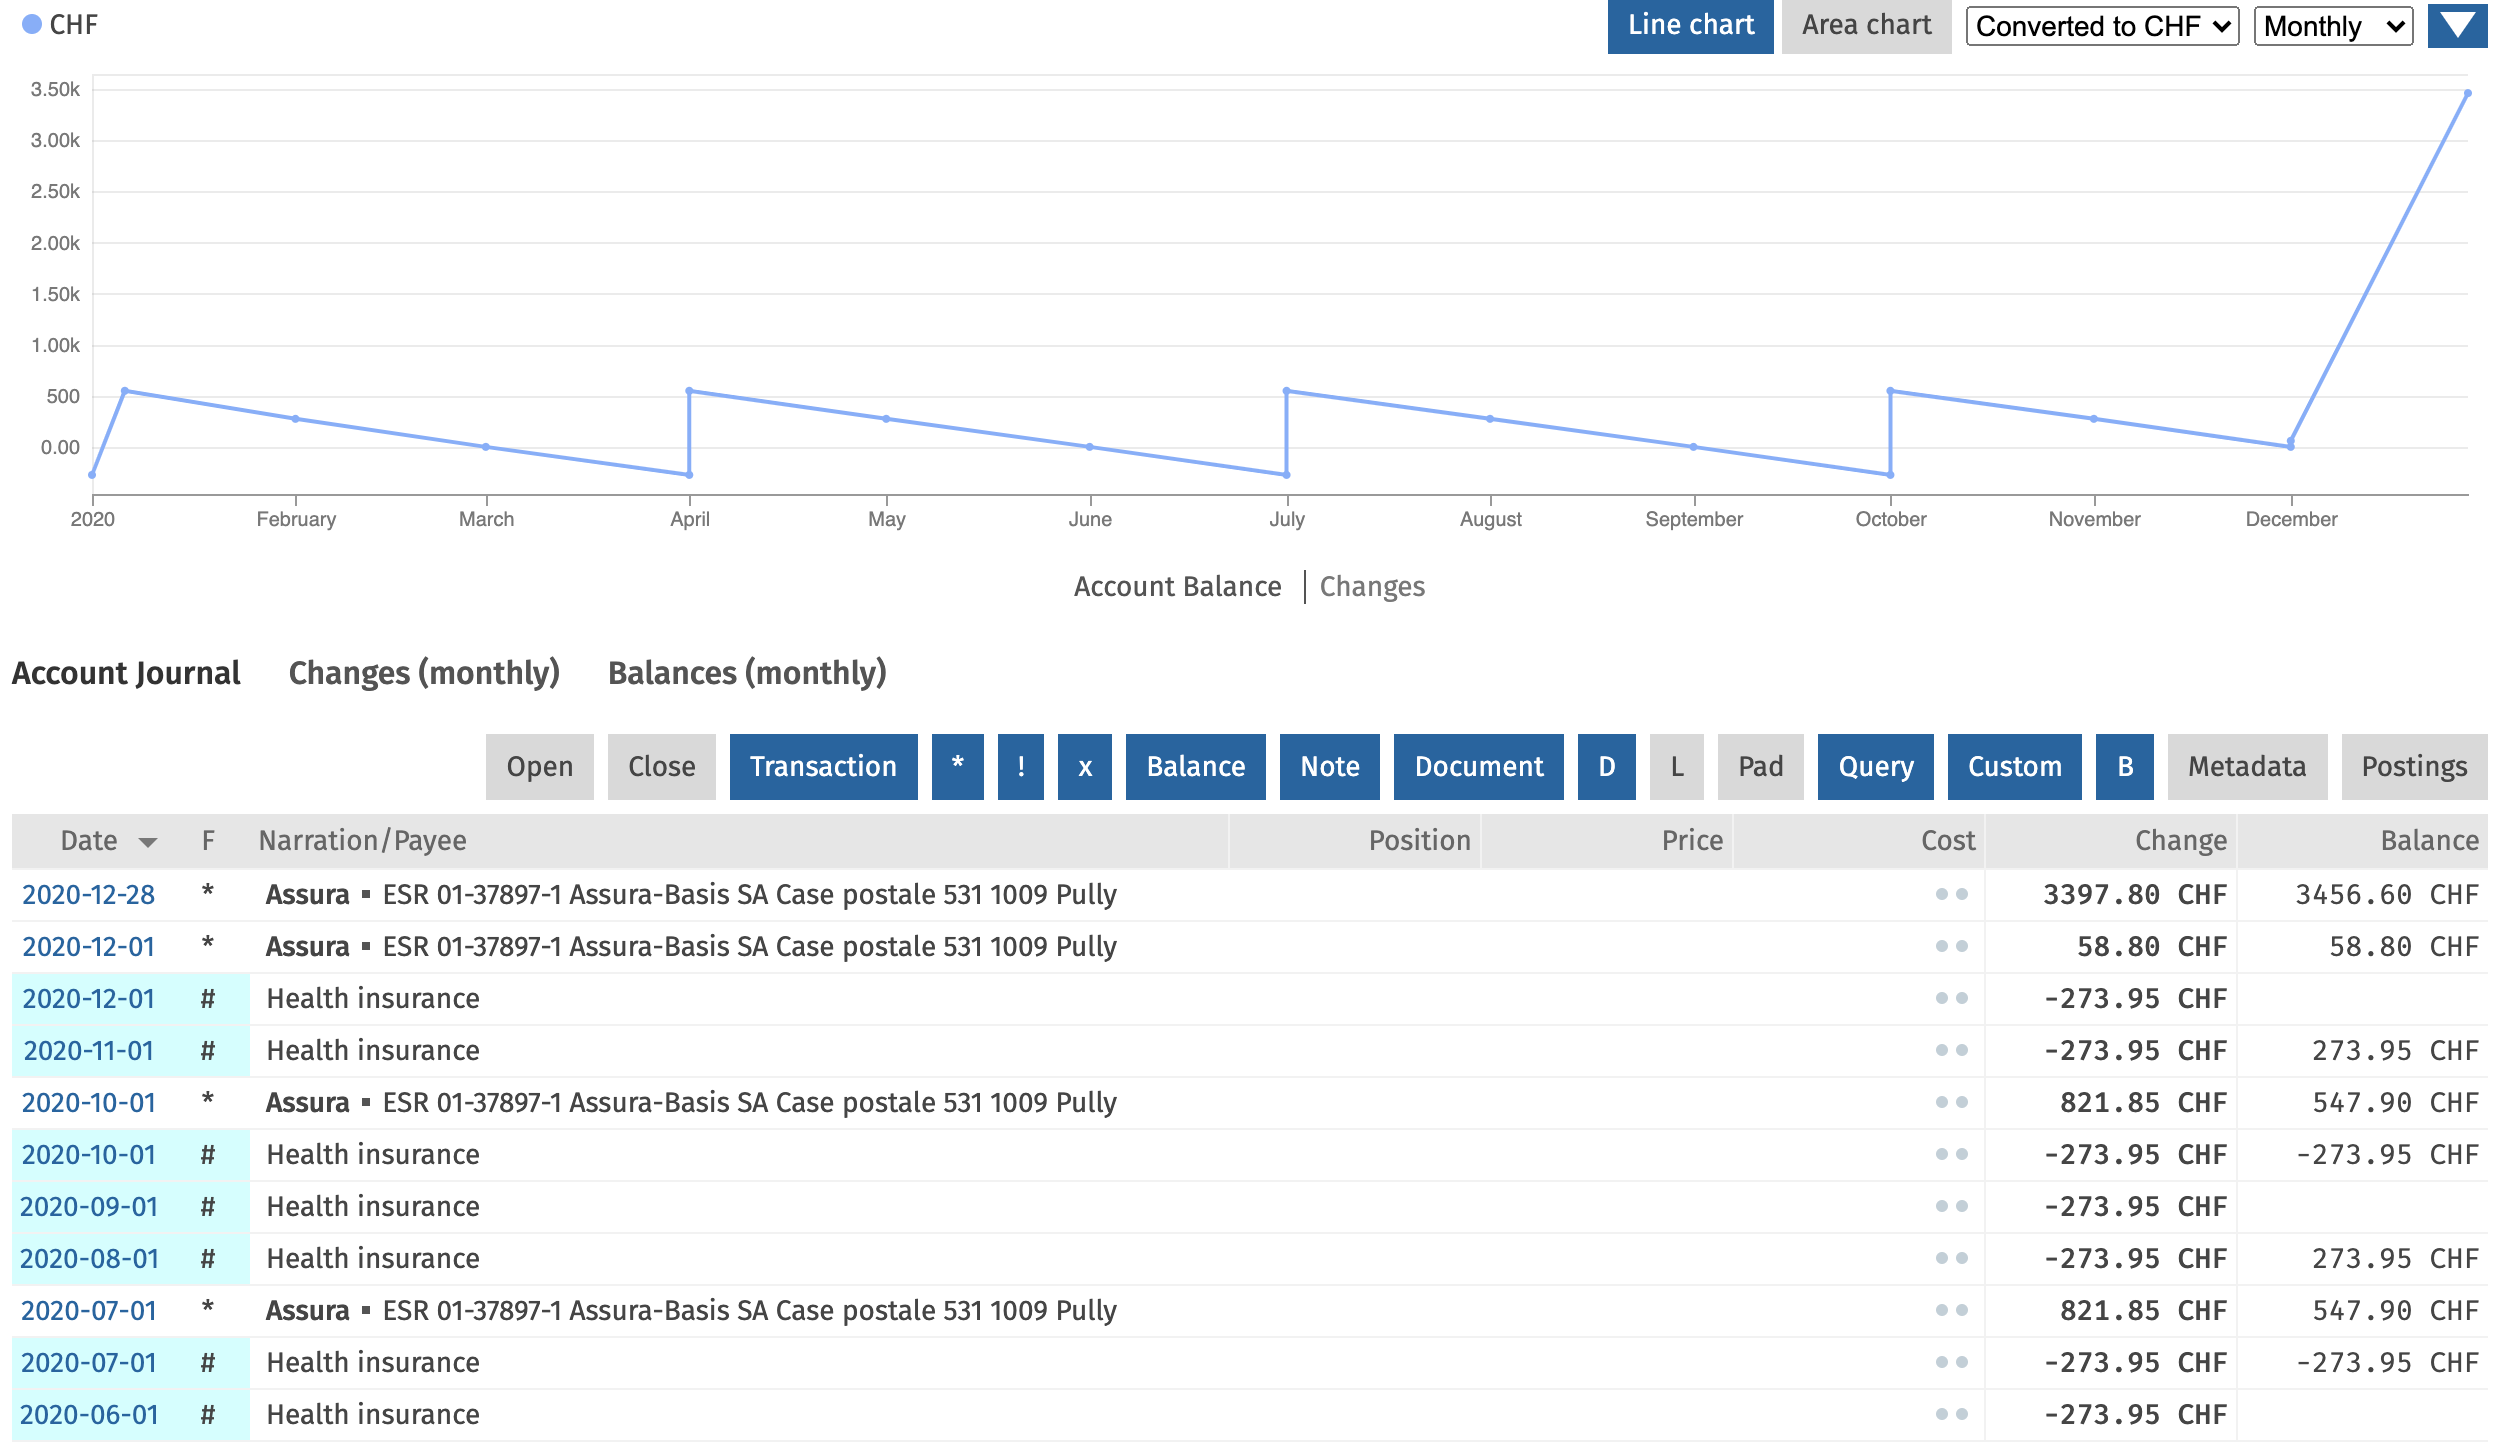
i.e. distribute my yearly health insurance bill in December 20xx over 12 equal monthly transactions during 20xx?
Same with VIAC PnL, where I just have the yearly value?
If you want to earn a like, post a minimal code example
After I’ve got the grasp of Python and Beancount importers & plugins, it would be fairly easy to write that, if I had the time…
One other thing that distorts my incomes/expenses is income tax. Since I’m no longer on withholding tax, I know that there will come a bill for a large sum that will explode my expenses for that month, and I don’t have that even spread anymore. So how to implement that? Mark every taxable income with a category and apply a plugin that will create a tax expense posting and a liability posting?
What I dislike about plugins is that they only appear after you’ve loaded them, they don’t alter the original file. It is a good thing (keeps original booking clean and lean) but also a bad thing (makes the displayed state very dependent on the plugin).
One other thing that screws up my income is that sometimes my client does not pay his monthly bill in even intervals. So I can get a month with no income and then a month with double income. Looks weird visually. The fix would be to track the actual time worked which creates a pending payment by the client. But that generates hundreds of extra entries and the need to import my time tracking into Beancount. And I have dedicated enough hours (DAYS!!!) into it already.
I think I just have to give up the hope that the charts in fava will reflect reality. What also sucks is that since I became a quasi-freelancer, my income and expenses exploded, so they’re not comparable with the past. The past is barely visible… It would be nice to have “buckets” that you could filter to distinguish private spending from business spending from tax.
i solved this issue with accounts for payables/recievables. if you issue a two bills in month 1 and 2, and both get paid in month 3, then your net worth still changed in month 1 and 2. This is exactly how i flatten my yearly bills.
Yes but at a point I had a whole year of shifted invoices (paid 1 month after they were issued) so I would need to create 12 fake transactions to move the receivables to the correct month. Seems not very elegant.
Actually, the banking system I work with has a concept of different dates for the same booking/posting. There is the book date, which reflects the bank date on which the transaction was booked. There is the transaction date which tell you on which date the transaction was actually made (like a weekend card transaction will get booked on monday). There is a value and performance date. The plugins are just hacks that go around the missing functionality in beancount’s core.
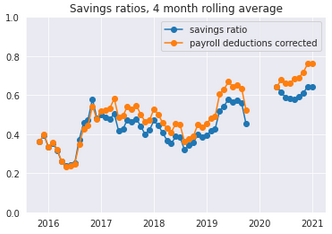
I just had a day of beancount hacking. besides a few other thing, one result is improved BQL knowledge, and associated querying of my income/ expenses /correction for tax/ etc, and some pandas magic. add a little bit of pandemic lockdown, and I get something like this here:
I think beancount 3 is not ready yet. But the main text file should be probably usable without much tweaking. The whole idea is to rewrite the core in c++ to make it much faster. I’ve noticed the speed problem already. The python-based beancount 2 takes a few seconds to load all of my transactions.
Sorry if that has been shared already, but does someone know how to export the right data using BQL to produce net-worth plots in the style of this thread?
I’m interested in making a stacked plot with monthly progression of net worth, converted to one currency.
I was also thinking about making a plugin with the idea of showing monthly income according to stock price changes (incl. dividends). I am not aware that beancount could do this?
Dear all
i just found out that Finpension.ch offers exportable (.csv) activity statements. This calls for an Finpension importer for beancount!
however the question is on how to ge price quotes for those CSIF products. Take for example
Name: CSIF (CH) III Equity World ex CH Blue -Pension Fund Plus ZB
ISIN: CH0429081620
Ticker: CSWPPZA SW
yahoo does not have it. I could only find quotes on bloomberg. does anyone have an idea how i can obtain quotes programmatically, like via the yfinance python package?
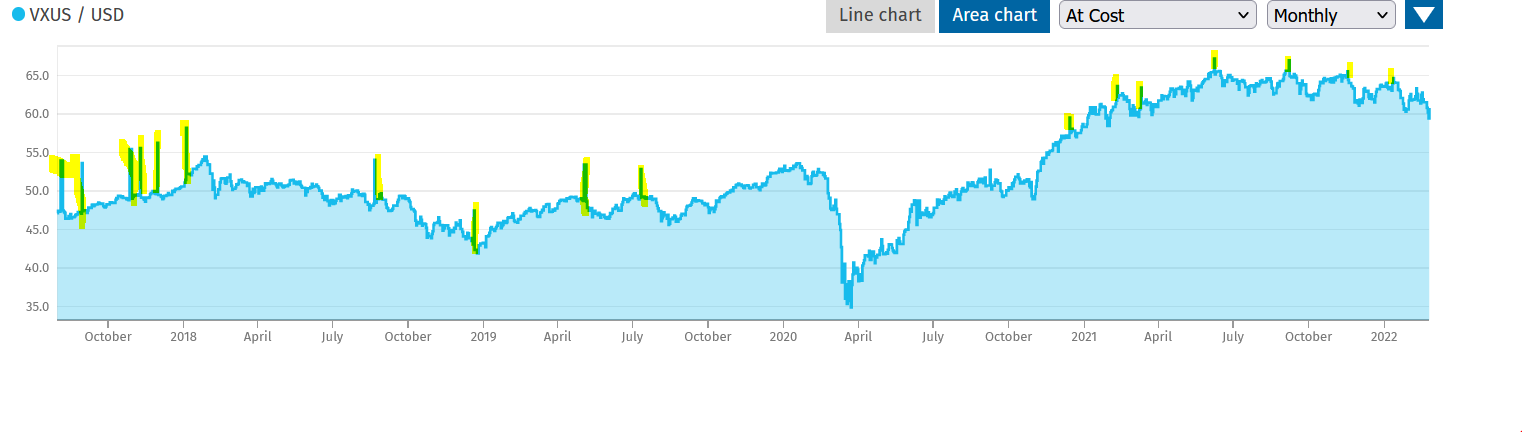
the data i just pulled yesterday via yfinance
those marked peaks coincide with trades I did.
The question is: Why do I see these peaks?
So far I figured out that my IB trades come with commodity prices attached. The cost basis in my IB pdf reports are onsistent with the peak values. And I expect that IB does not have a spread of 10% on VXUS
So could it be that the yf data is somehow different? Could there be something like the yf data is/is not reflecting distributions?
Mit dem Lesen und der Teilnahme an diesem Forum bestätigst du, dass du die Forum-Richtlinien gelesen hast und damit einverstanden bist sowie den Haftungsausschluss auf http://www.mustachianpost.com/de/ akzeptierst.