I bought a few TEAM stocks in 2016 (200x TEAM $23.30 = $4660). I just kept it in my portfolio watching it grow (about 1400% increase since, value on 01.01.2022: $76’000).
Since the beginning of 2022, it’s losing value day after day: (date / stock value / total value)
01.01.2022 $381 $76’000
04.01.2022 $350 $70’000 -8.8%
05.01.2022 $334 $67’000 -4.4%
06.01.2022 $311 $62’000 -7%
13.01.2022 $298 $59’500 -7%
Normally I just hold, but here after losing potential gain of about $16’500 in 2 weeks, I’m wondering why it keeps crashing.
Is there anything I missed or any hints about what is happening ? Maybe a lot of internal stock sales from board ? I’m just an hobby investor, with more or less luck, and this is bugging me a bit
Do you still plan on holding? If not, what would make this situation abnormal? Individual stocks come down 20% on a regular enough basis, especially after a good run up.
The Nasdaq has been going down more than the S&P500 since the start of the year, I guess market participants consider that something in what they expect to be the future would be bad for tech stocks. Atlassian could be caught in that wave, or there could be something specific to the company.
Thanks for your reply @Wolverine, yes of course fluctuations are normal, I was just wondering about the reasons for the ones of the last 2 weeks.
But I think I should have checked the graphs over a longer time before posting : now it seems clear the trend started on 01.11.2021 (stock price $450 then, today at close: $298), just after the fiscal year results publication (Atlassian - Atlassian Announces First Quarter Fiscal Year 2022 Results). So I guess it’s just some more investors/funds noticing the results and reacting.
Not sure about what to do, the company and the products are (still) good. I’ll probably still hold some more time and forget about it, as I have no use for the money there right now. Maybe Microsoft or another big one will want to take them over…
Can you explain where/how do you see that in their financial statement? I’m learning how to read those, still a beginner and it’s not that clear when I look at their data (but not sure I look at the right place)
The resident accounting gurus on the forum surely explain it better than I.
But for starters look at operating income and net income. Keep in mind that these figures can be manipulated by accounting and that these figures in the income statement aren’t the only important ones (-> debt & cash flow).
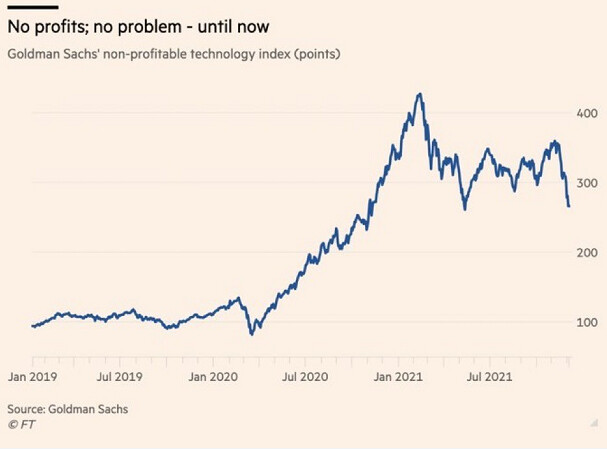
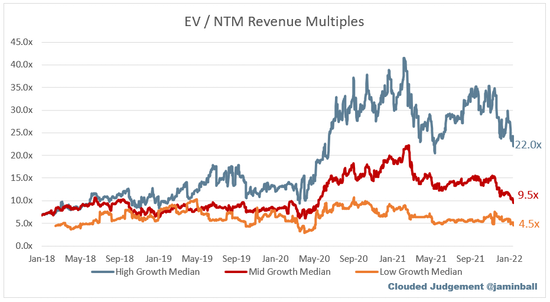
Growth stocks are being slaughtered because there was a bit of euphoria - the multiples were ridiculous, see graph below.
Also, now we are seeing the Fed stoping the money printing + raising rates to fight inflation. In this scenario, discounted future cash flows to the present value, are worth less. Also, these companies typically are still burning cash to keep expanding, so it will also be more costly to borrow more money / pay the current debt.
$TEAM is probably in the Mid Growth in the graph, getting closer to pre-covid multiples, however from a technical perspective, the next resistance is at $260-270.
Looks like $TEAM is a big part of your portfolio, so maybe you should think of diversifying.
Gitlab is good yes, just stay away from $GTLB (bought some of them too early of course).
$TEAM seems to be relatively stable again, crawling around $280-$310 the last days.
By reading and partipating to this forum, you confirm you have read and agree with the disclaimer presented on http://www.mustachianpost.com/
En lisant et participant à ce forum, tu confirmes avoir lu et être d'accord avec l'avis de dégagement de responsabilité présenté sur http://www.mustachianpost.com/fr/
Durch das Lesen und die Teilnahme an diesem Forum bestätigst du, dass du den auf http://www.mustachianpost.com/de/ dargestellten Haftungsausschluss gelesen hast und damit einverstanden bist.