Interesting, people love Greek bank stocks, and universally hate Greek banks (which…they have to use). I guess the two are related ![]()
1 Like
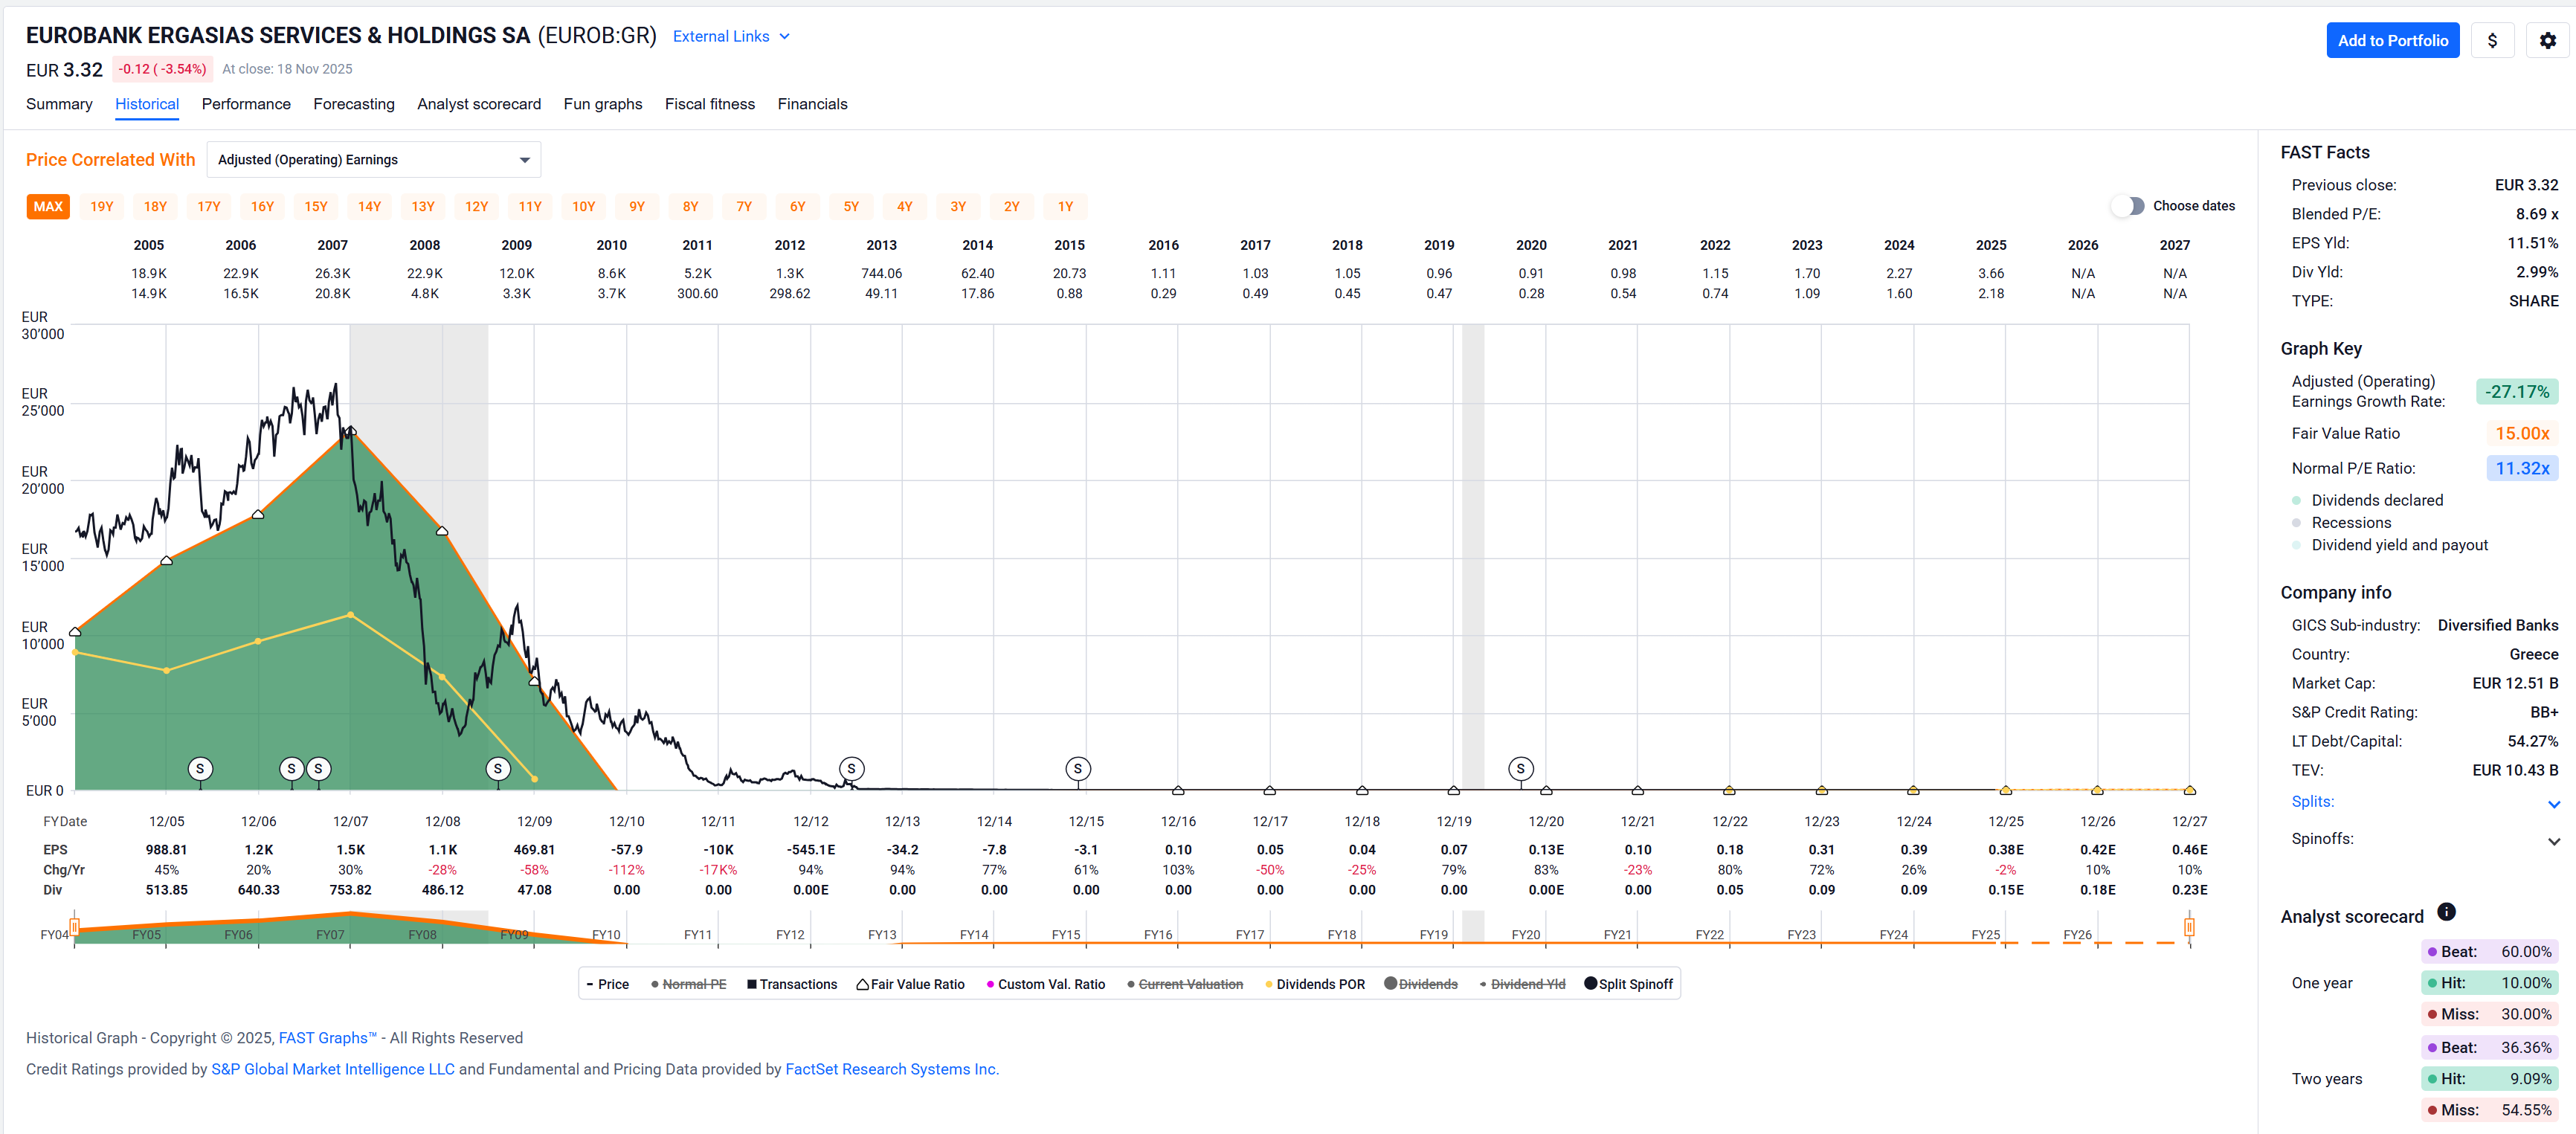
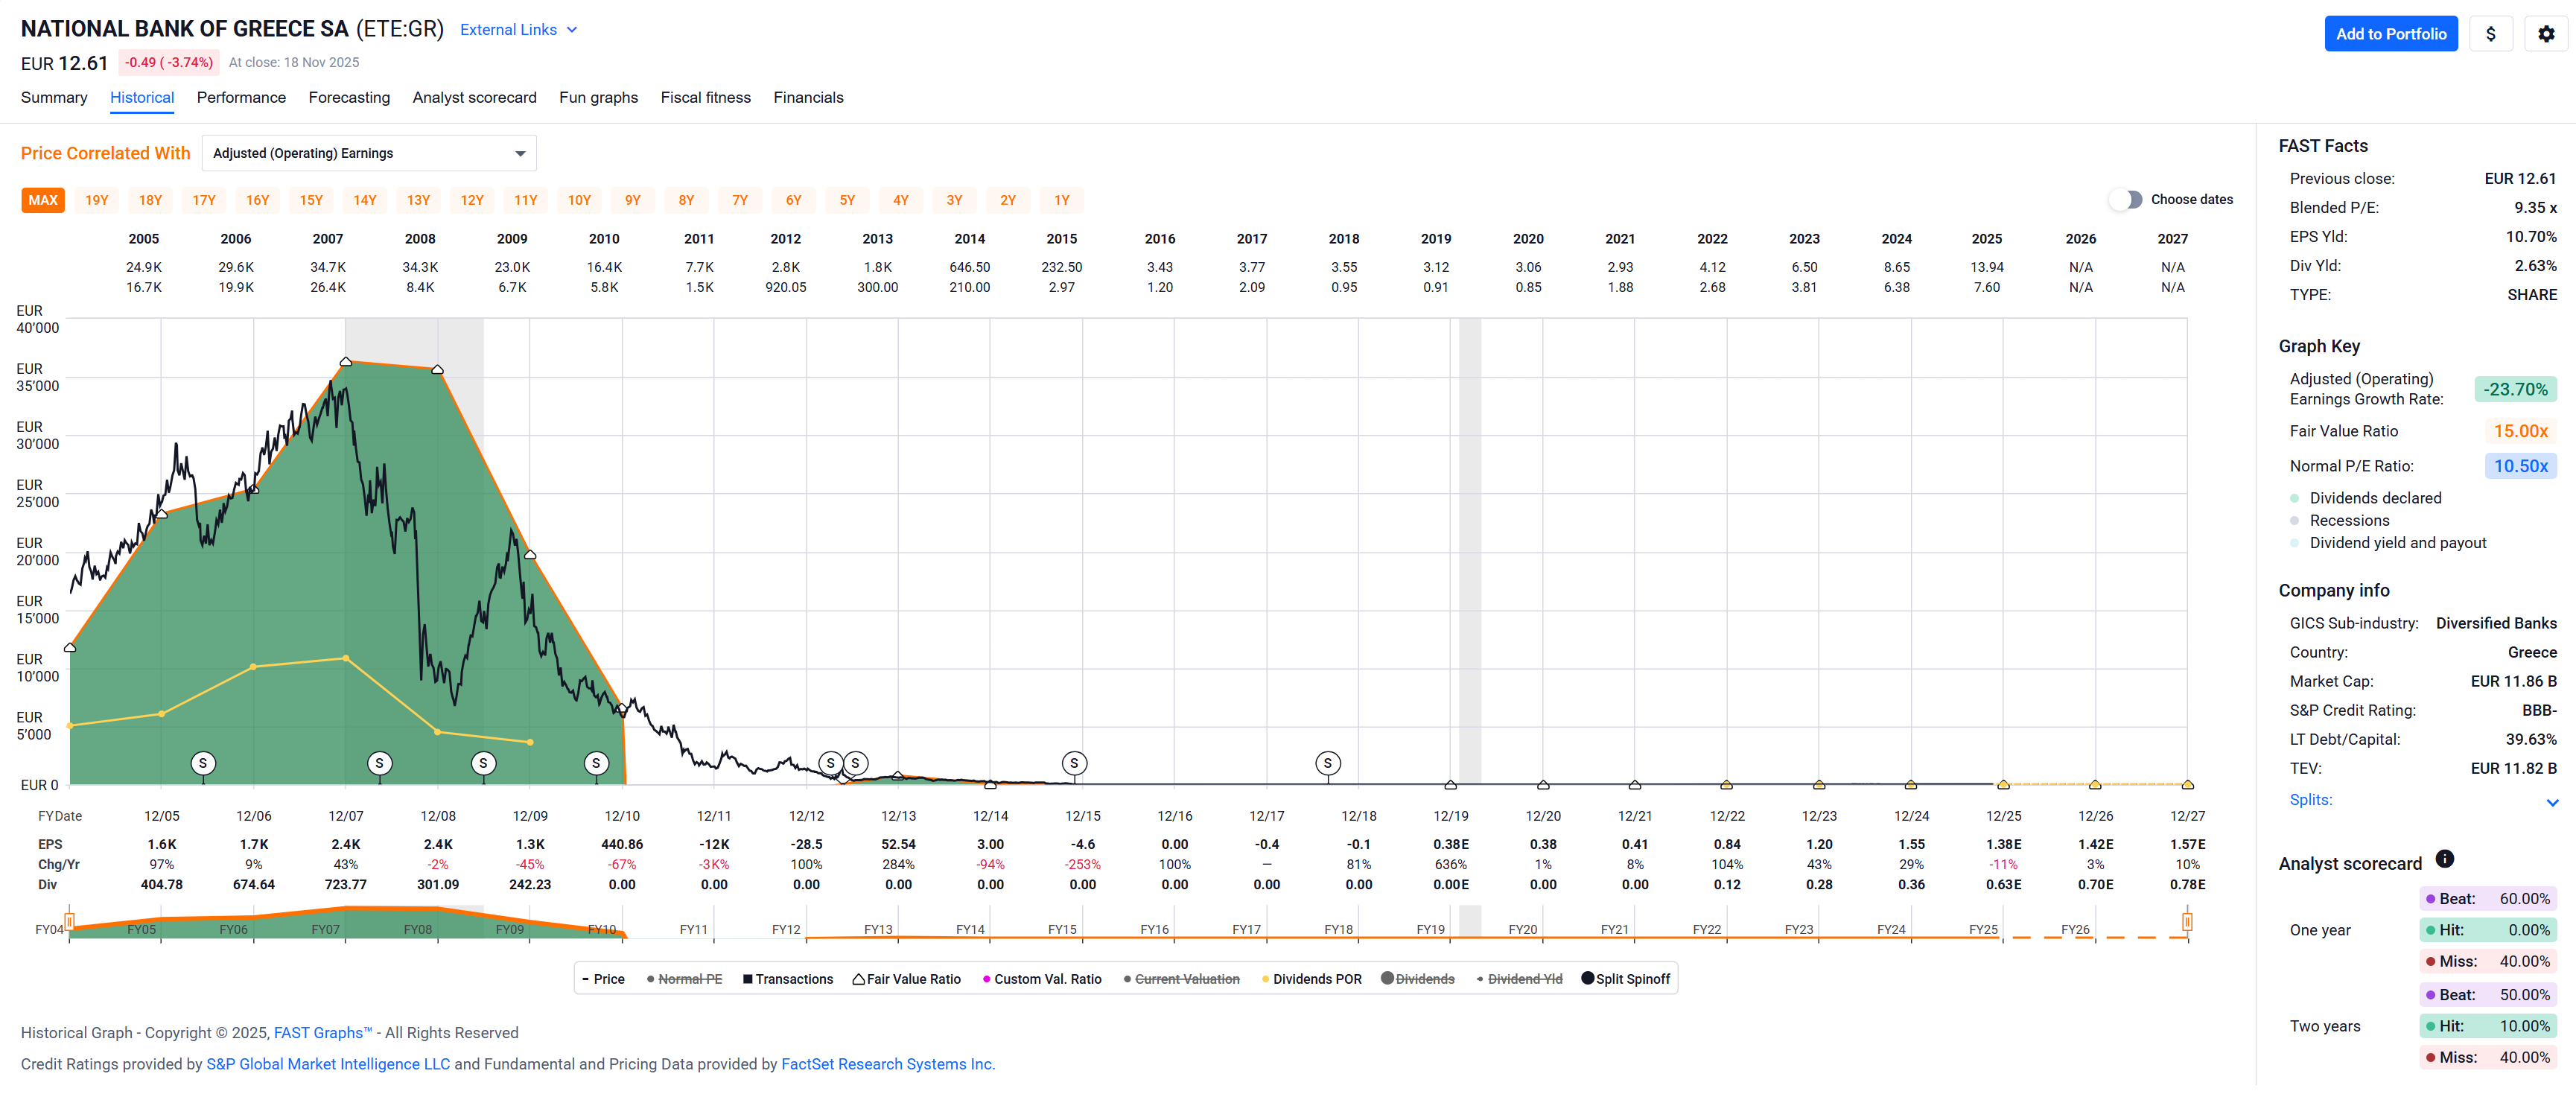
When you zoom out far enough for the banks I listed, I can easily see how one can hate them also as an investor:
EUROB:
ETE:
ALPHA:
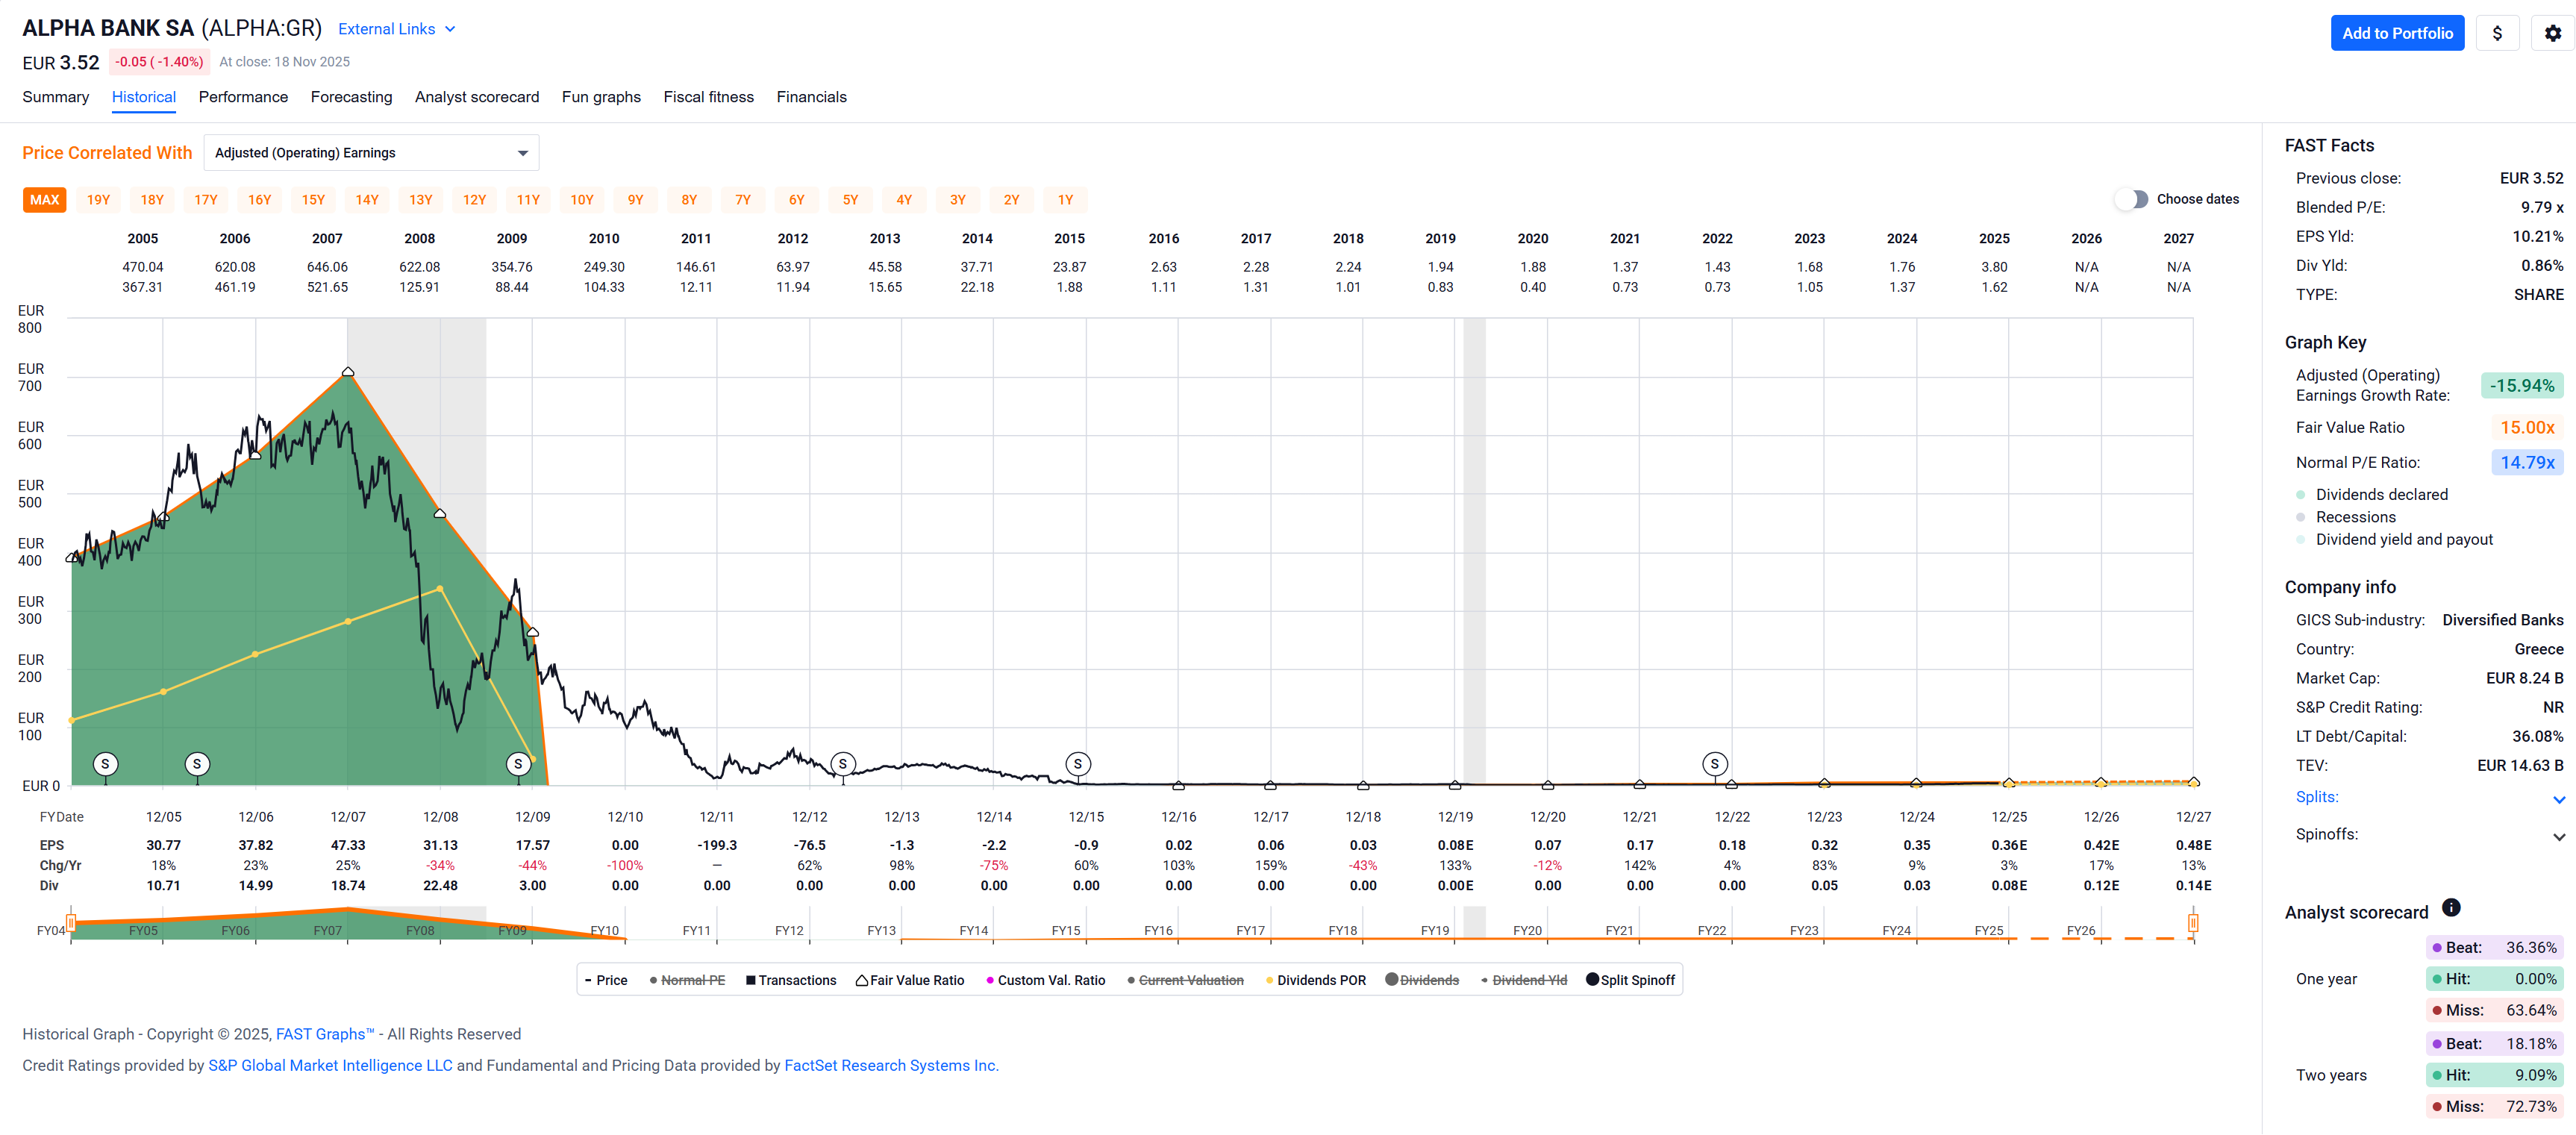
They all look alike and if you bought them before, say, 2020 or so … ouch!
1 Like
Anyone else observing seemingly weird metrics for their hand-picked portfolios?
I’ve recently discovered (just anecdotally so far) a potentially interesting metric for my stock picked portfolio: whenever total capital gains “far” exceed – like 10% or more (going up to 20% or even 30%) – the total cash flow[$] produced by the portfolio the overall valuation of my portfolio seems stretched and corrections seem to happen in due time.
OTOH whenever the two are balanced (or capital gains even drop below total cash flow produced) my portfolio seems what I would call fairly valued, but the market apparently judges as it as undervalued, the capital gains tend to bounce and pick up again compared to the total cash flow.
Most recent anecdotal[$$] data point: over the past couple of months or so the total capital gains were dropping towards the total cash flow and yesterday dipped below them. Today, the portfolio bounces about a 1% (on pure capital gains).
I recall having seen this pattern in the past but did not pay much attention to it. This time around, I feel it might be useful as a signal to myself.
My CAGR since inception is about 13%, and wouldn’t it be nice to have a simple mechanism to increase this (though I’ll still have to go through every position in my portfolio instead of just being able to buy another share of the Goofy ETF).
I guess from a distance the pattern is maybe not that weird: over a longer term perspective the CAGR of the portfolio can apparently be divided into ½ contribution from cash flow and ½ from capital gains. When the two get out of balance, the rubber band is stretched and is bound to return to equilibrium …
$ Sum of dividends (~70%), profits from sells (~26%), and option premiums (~4%).
$$ I plan track this more closely going forward and will pack some formulas and new Google Sheets tabs into this as a potential signal for myself when it might be time to sell (or at least not buy) or when it might be time to buy.
I always feel that Hollywood is copying me:

In other news CPB exec tries to tank the value of another one of my holdings:
1 Like

Goldman Sachs London calling their clients “muppets” is more refined, innit bruv? ![]()
1 Like
I’ve looked at Campbell in previous years, but they just don’t seem to be able to grow their earnings.
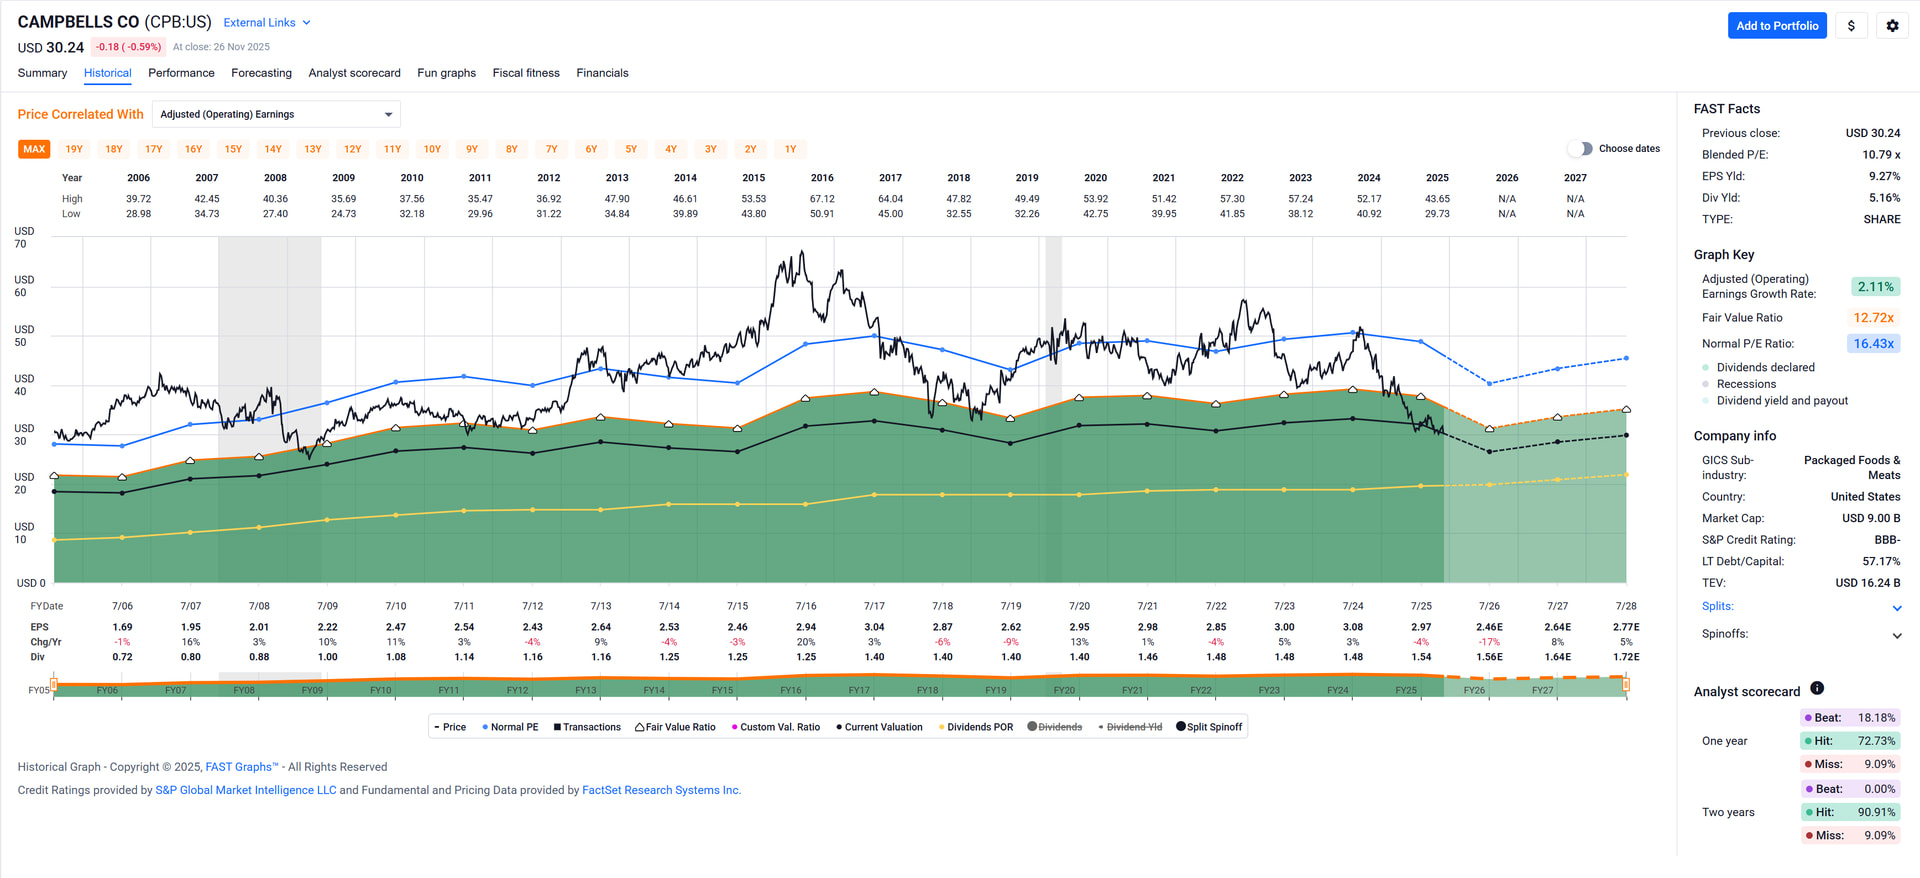
OTOH they’ve mostly traded above the fair valuation and have never traded at a valuation as low as now in the past 20 years …
Came across the MTY Food Group (Restaurants) today (via Kuppy) and feel tempted.
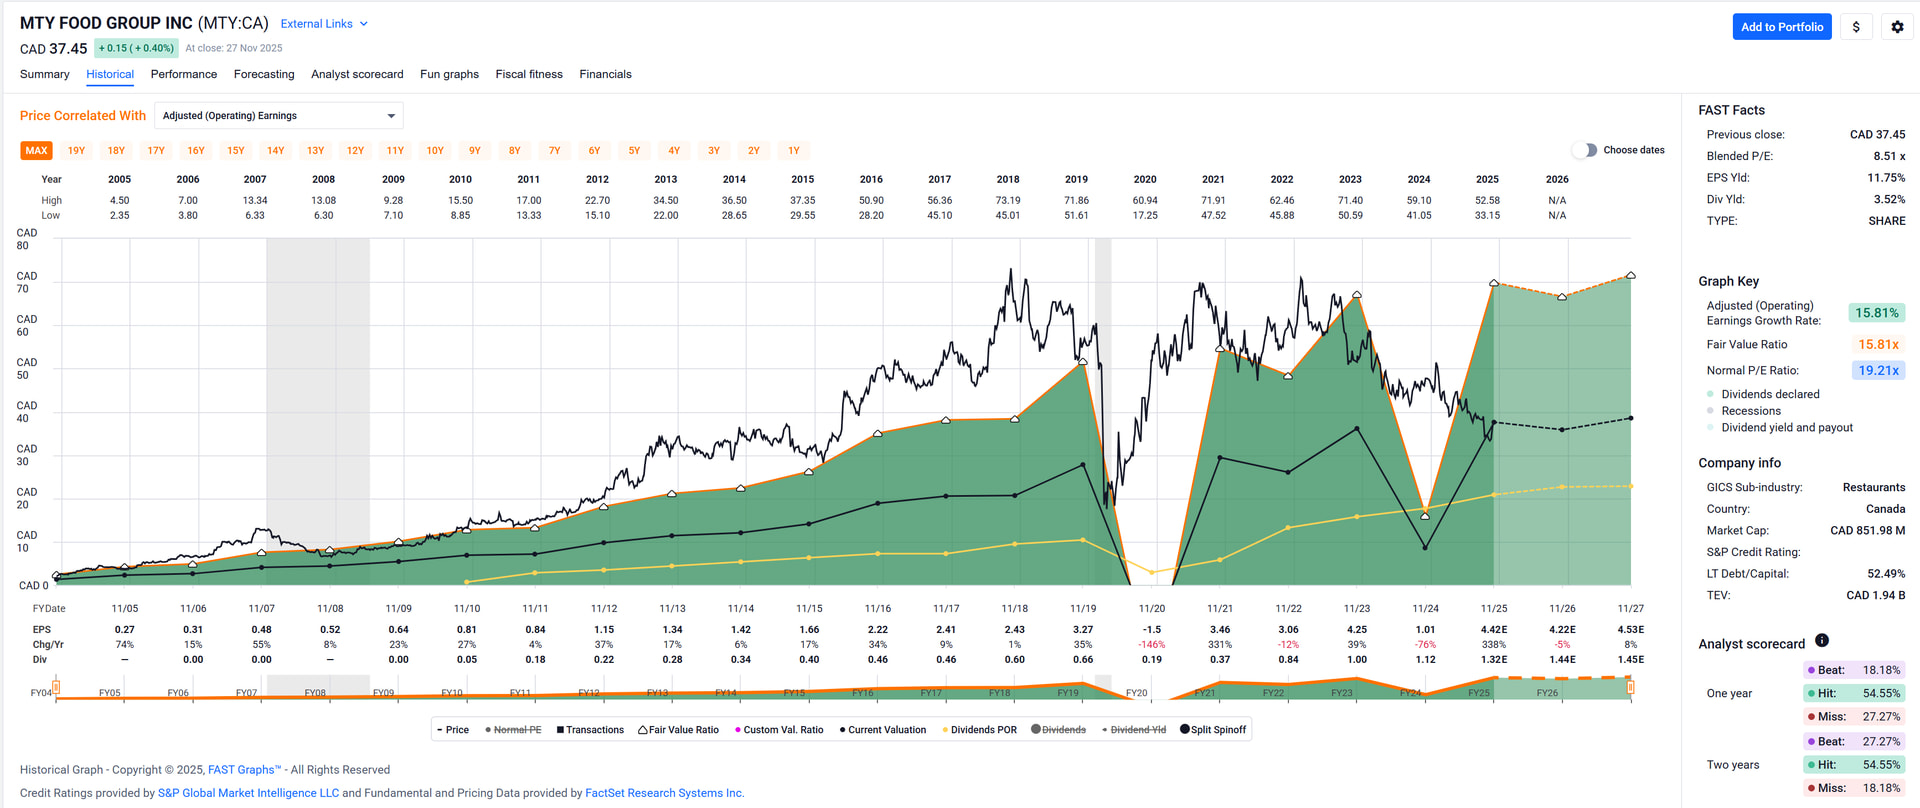
Small cap, almost 12% earnings yield, low dividend payout ratio, nice growth over the past 20 years.
Only thing I don’t like much is their dividend cut, but I suppose it’s understandable given their business and the lockdown ensuing COVID-19.
Kuppy’s notes on the company:

Well, after selling off a bunch of VICI, it dropped. So I’m buying again today.
This is a new and unusual feeling, stocks normally drop after I buy them.
2 Likes
Came across an interesting company that’s been intriguing me more and more as I take a closer look: Vopak, active in oil/gas/etc. storage.
Low multiple / reliable cash flow (multi year contracts with inflation terms) / once they invest in a terminal it becomes relatively cheap to further expand it / solid dividend and solid div growth track record
As I started looking for other companies in this space, it became clear that most have been acquired (by PE firms or strategics).
Roughly 50% of Vopak is currently owned by a Dutch investment company (HAL) which tends to take a very long term view (i.e. they won’t suddenly dump the stock; in fact… they may even take it off the market at some point).
I’ve not taken a bite yet and if / when I do, may do it by writing put options.
Would it be possible to get one of those nice charts for this one? Thanks in advance!
2 Likes
Assuming you’re looking at Royal Vopak:
Seems somewhat volatile on price, but generally growing on earnings:
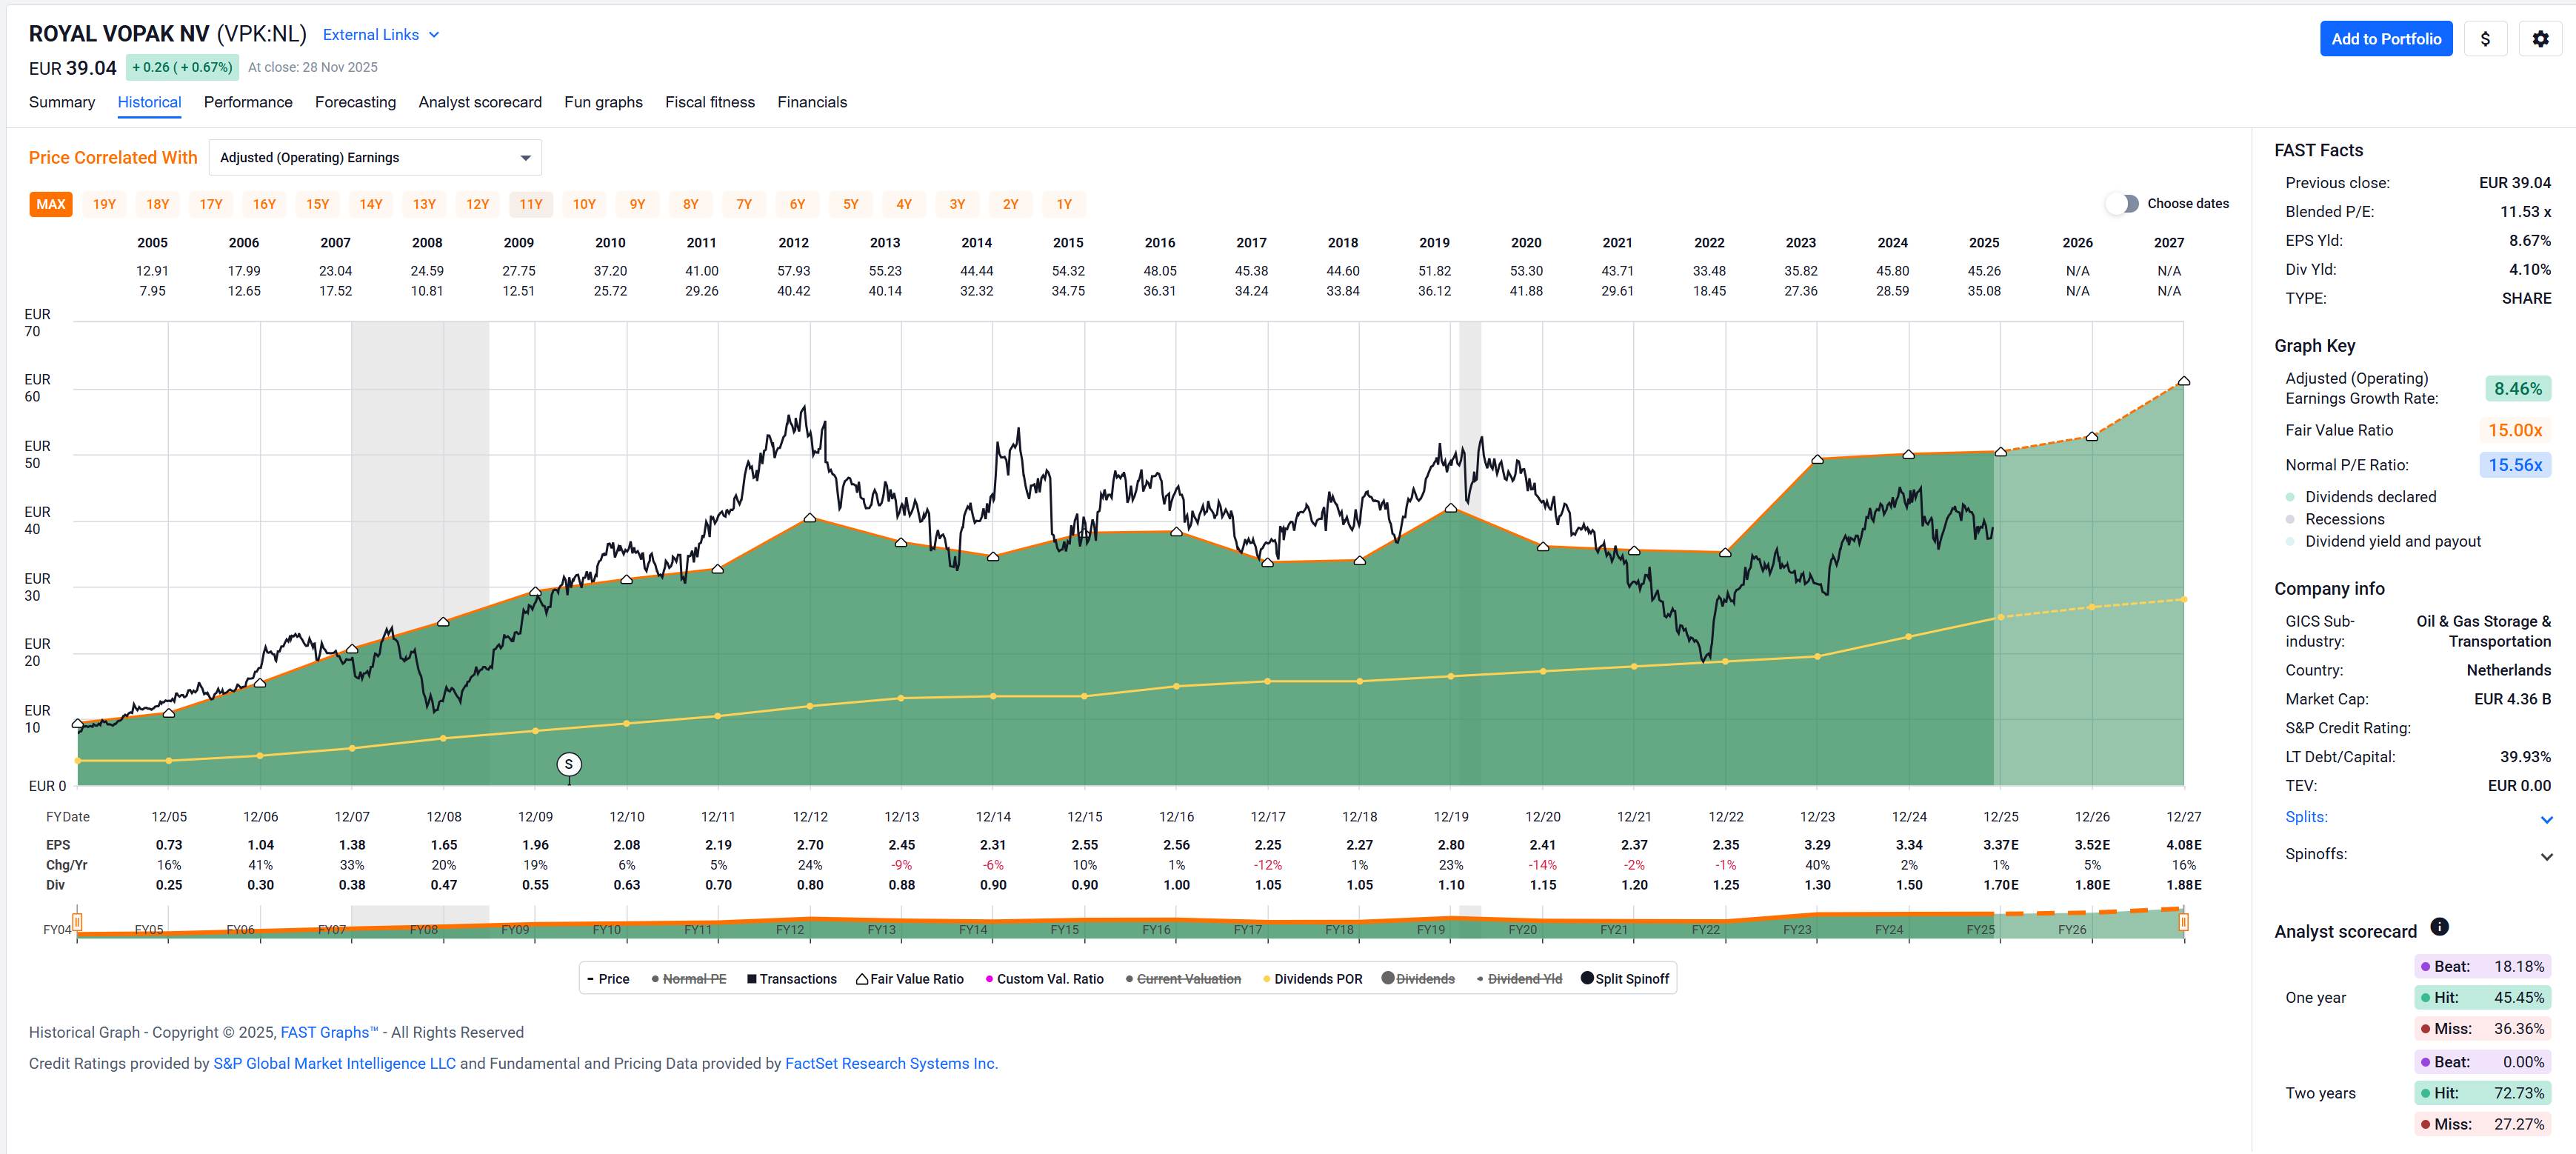
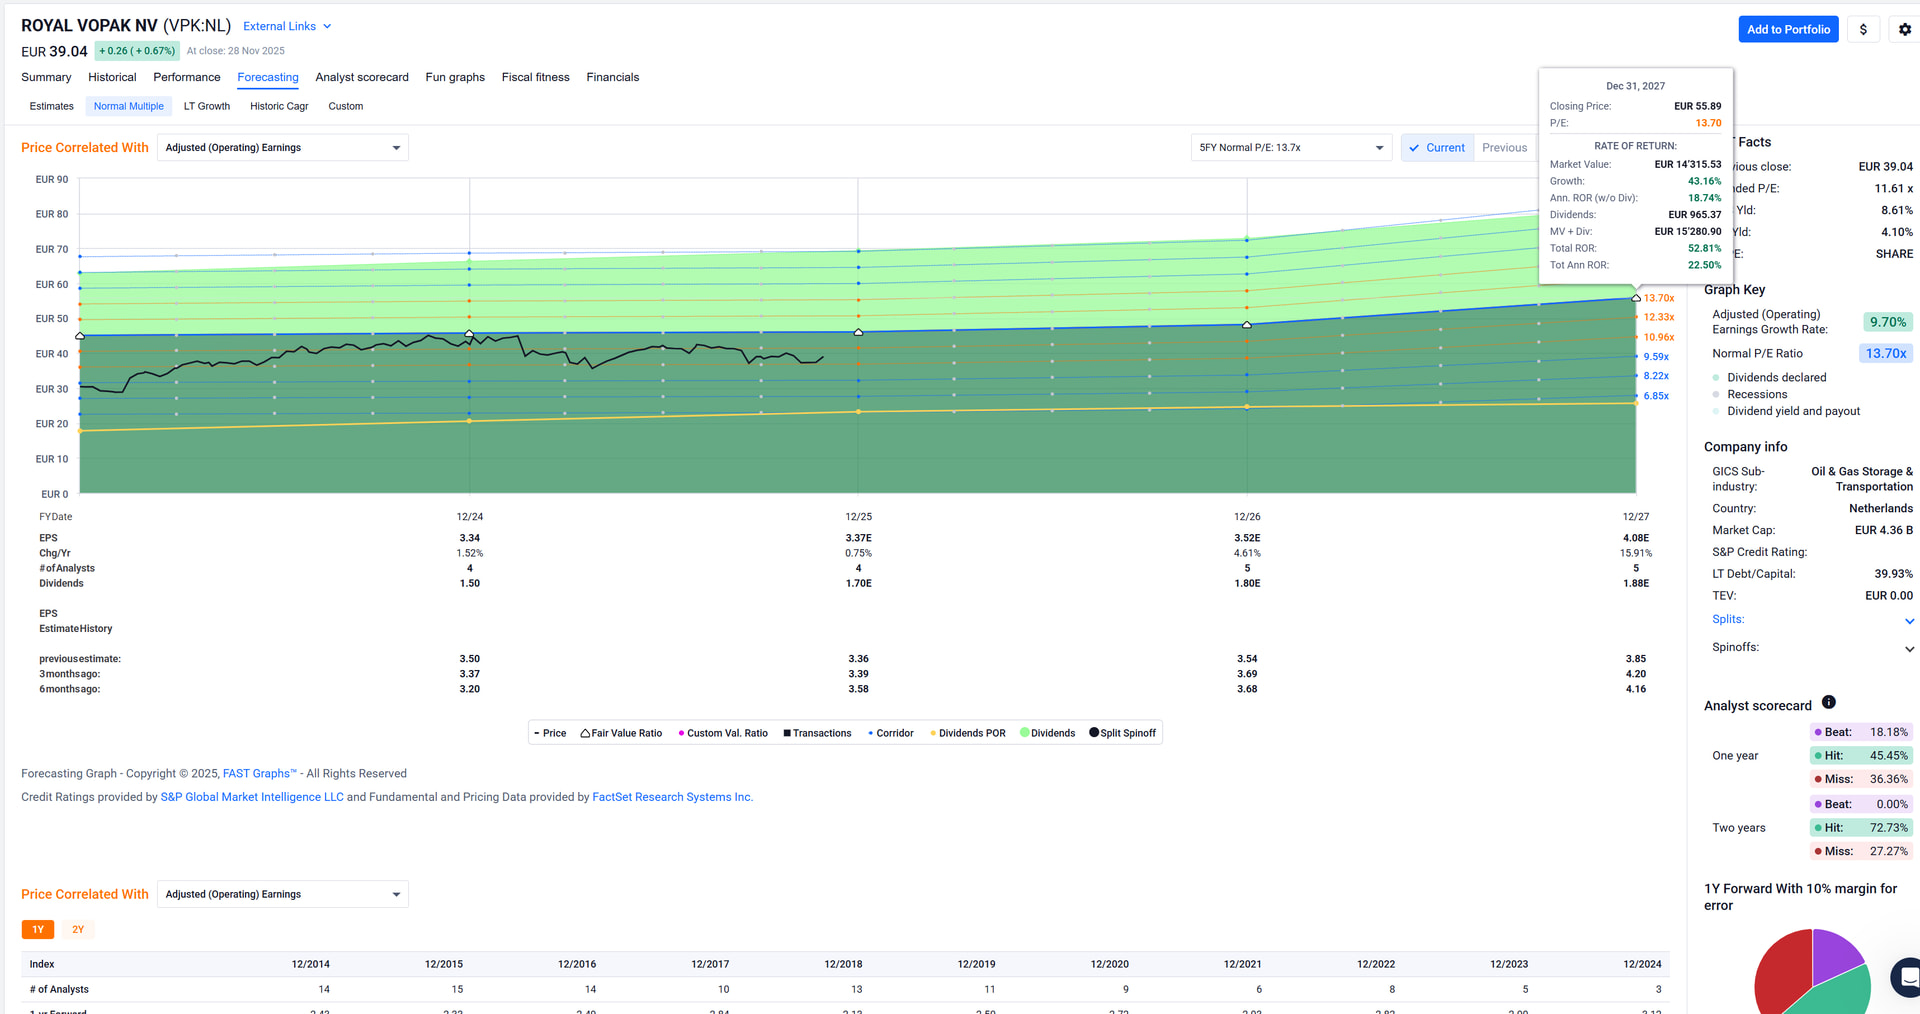
I personally would not object to it. I especially like their dividend history.
1 Like
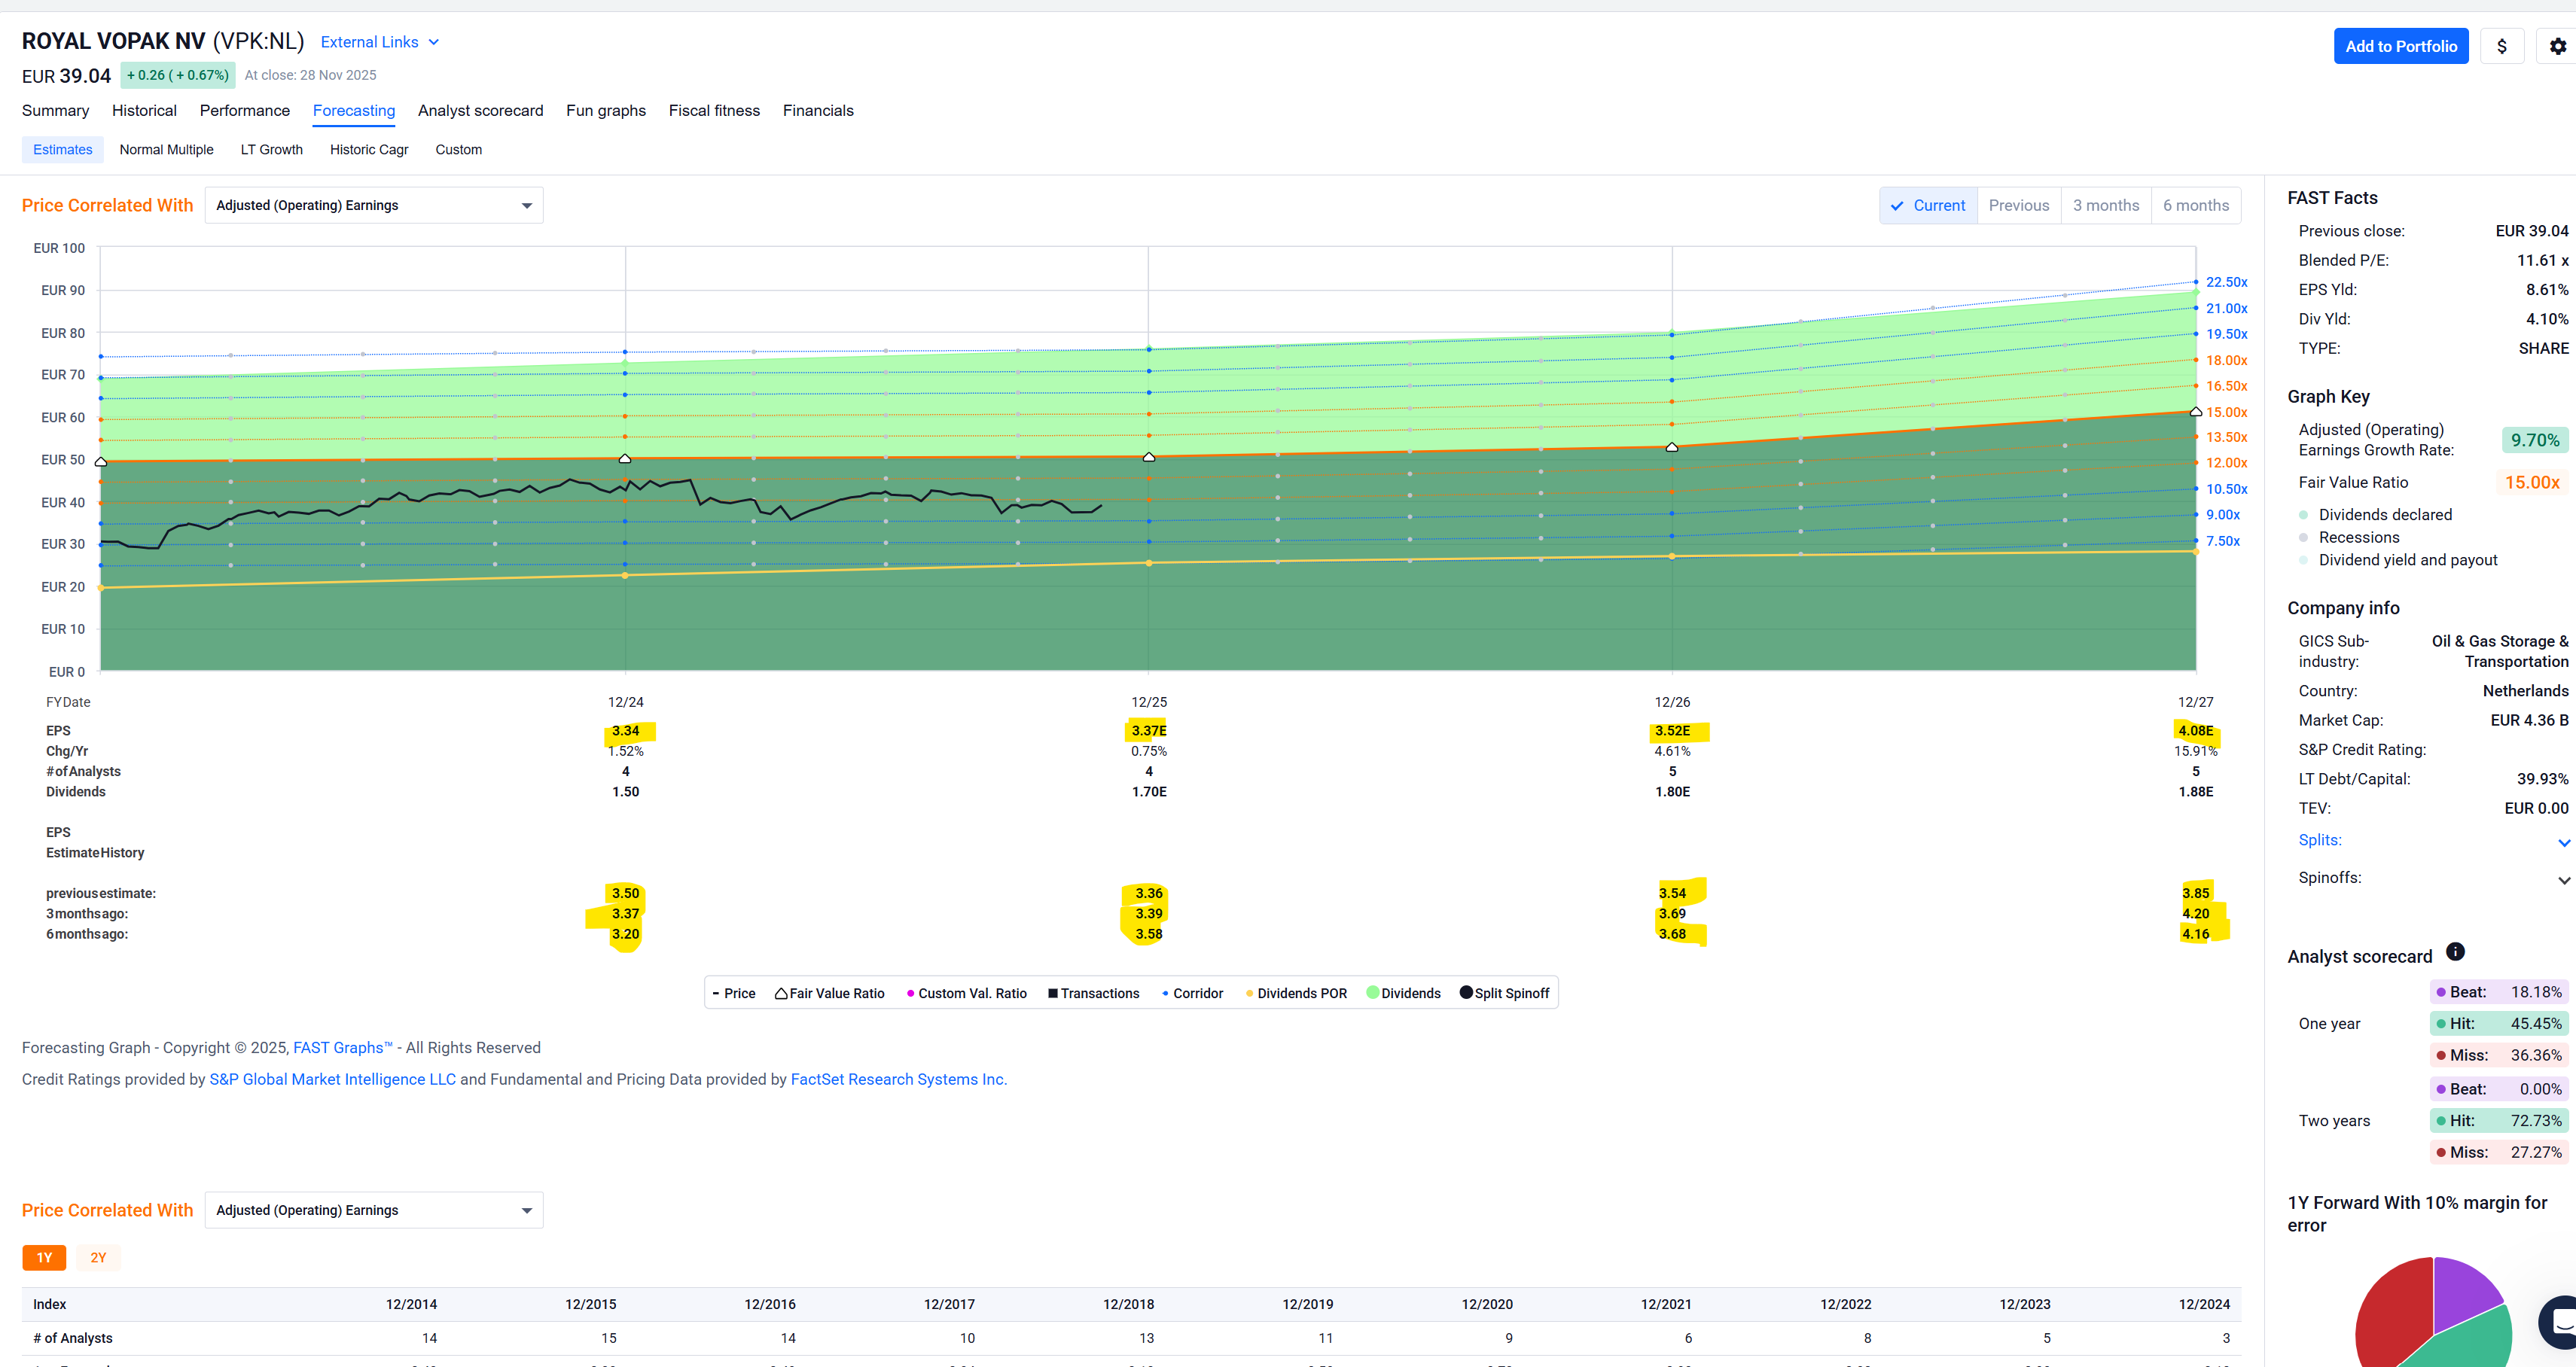
Thanks for the graphs!
The PE may be misleadingly ‘high’ (everything is relative of course and 12 isn’t that bad) - substantial growth CAPEX from prior years is now starting to drive cash flow. The multiple on cash flow is (if my quick and dirty assessment is correct) substantially lower than 12.
1 Like
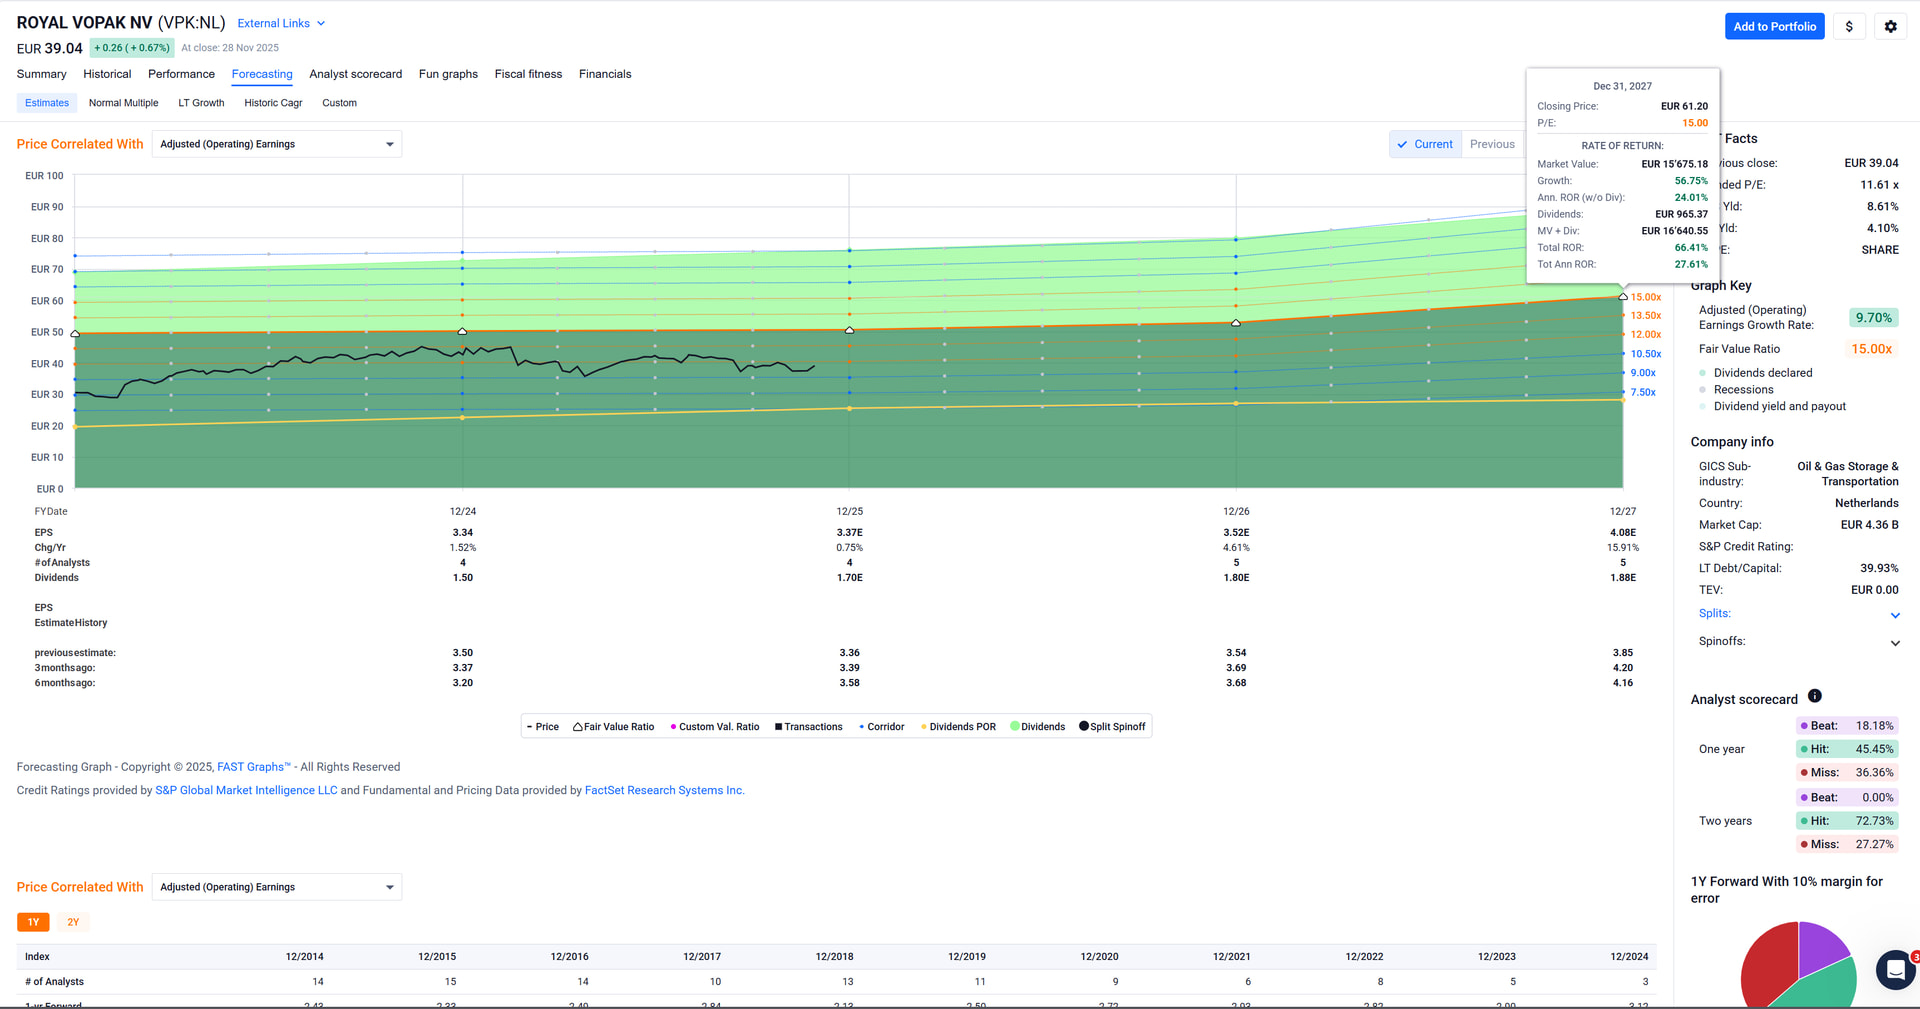
Blended[$] price per operating cash flow is at about 6x according to FASTgraphs. ![]()
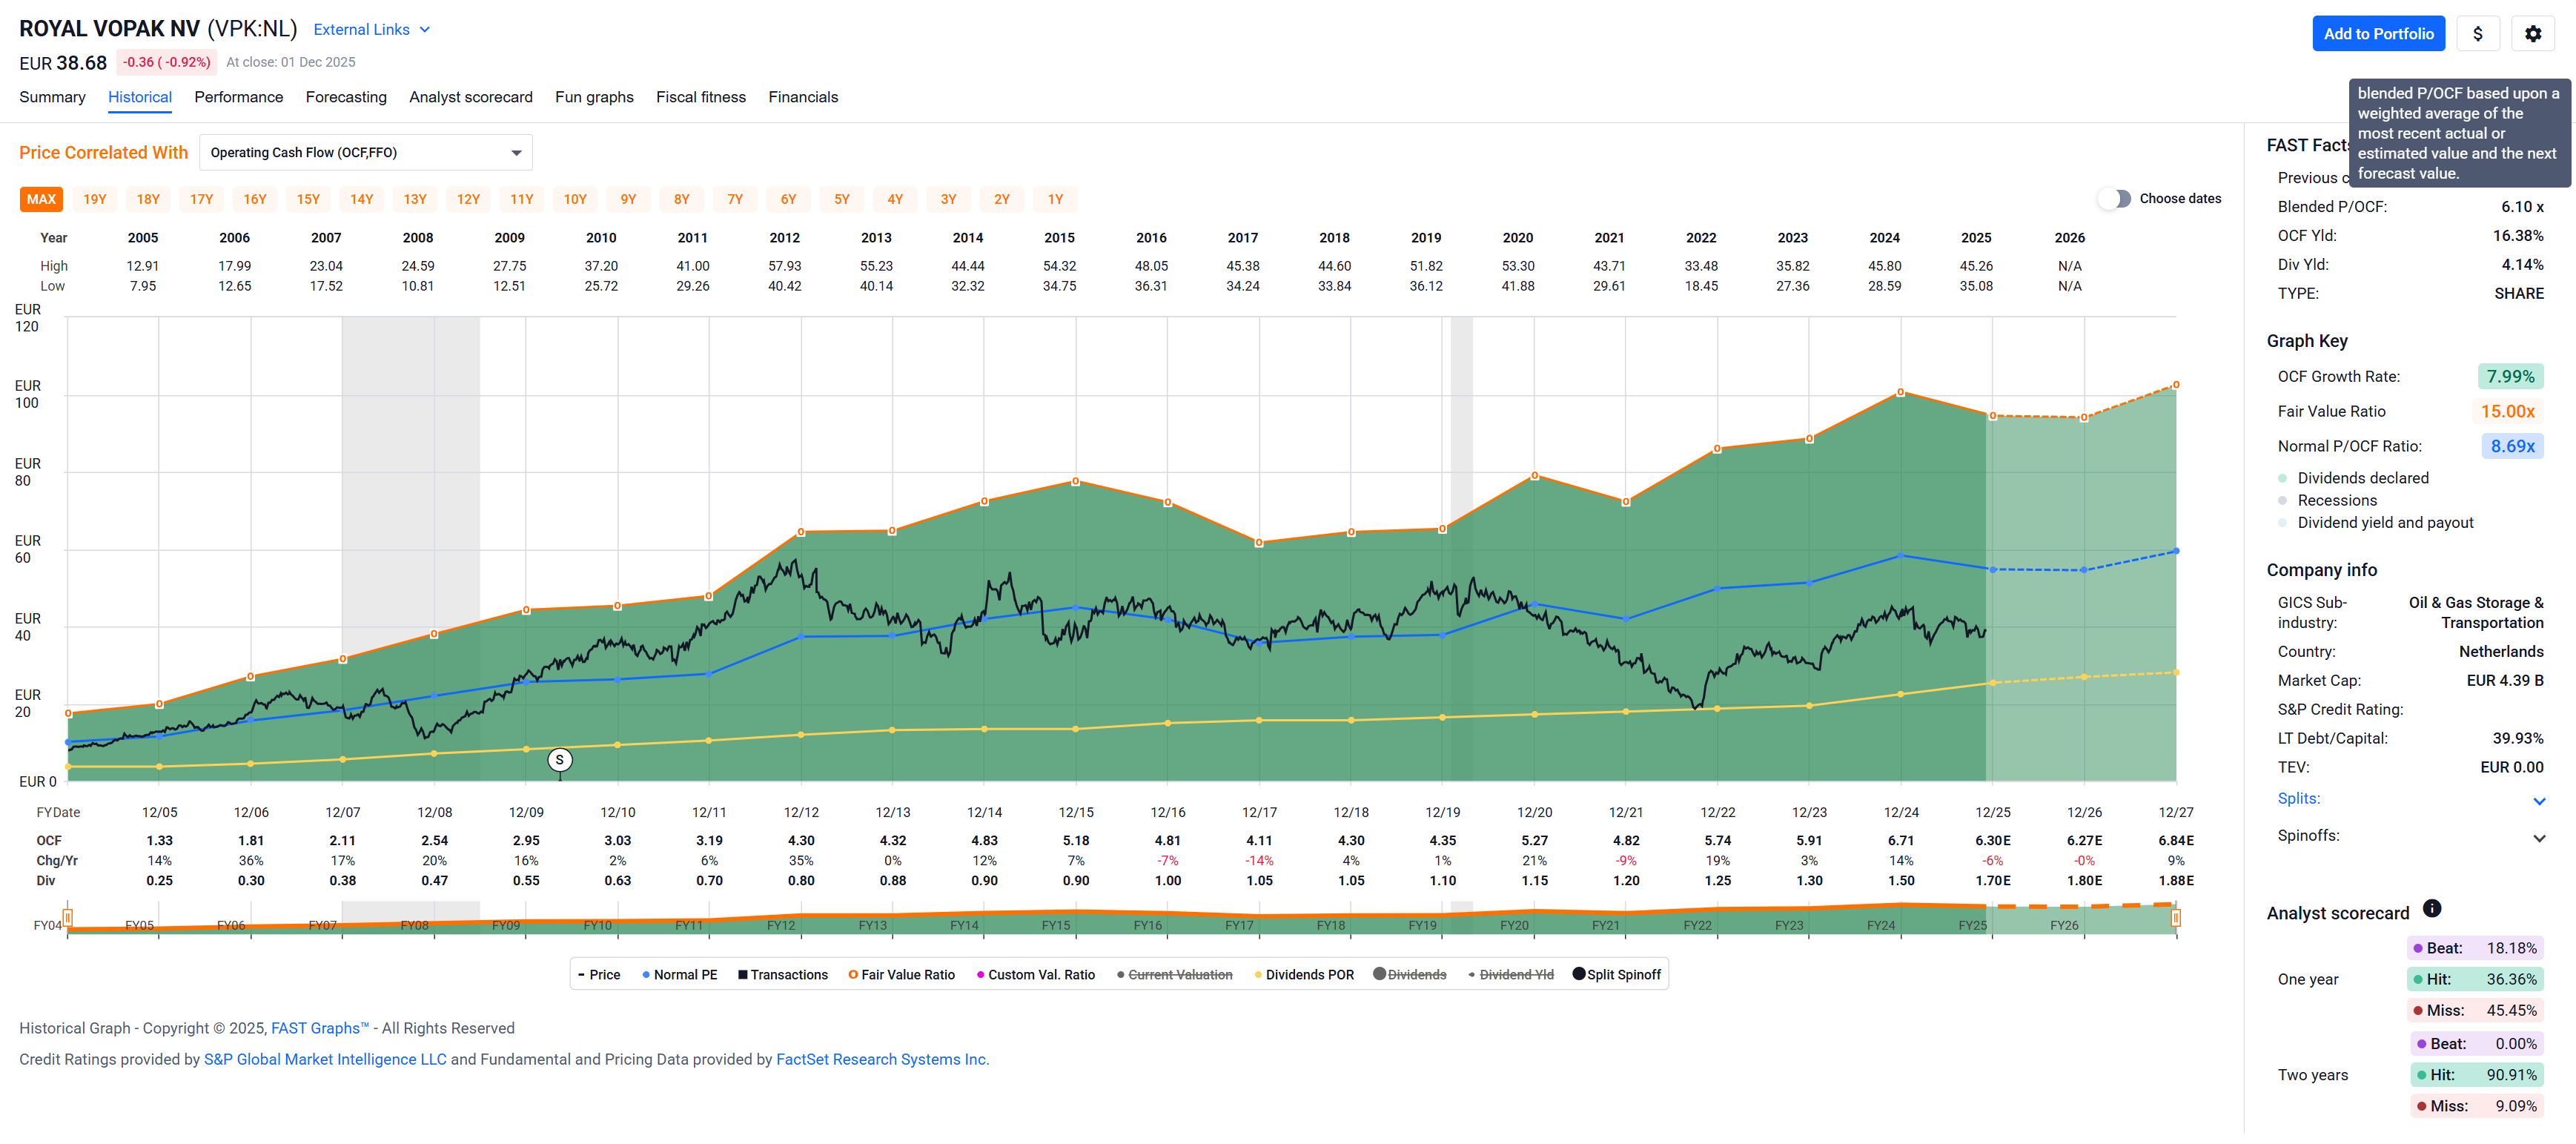
Looks fairly cheap to me. Certainly the dividend seems well covered.
(Free cash flow IMHO isn’t a useful metric here – at least as displayed in FASTgraphs – since as an Oil & Gas Storage & Transportation company they probably have bursty capex and FactSet/FASTgraphs doesn’t display a trailing x years view but a blend of past FCF quarters and estimates of forecasts. For completeness:
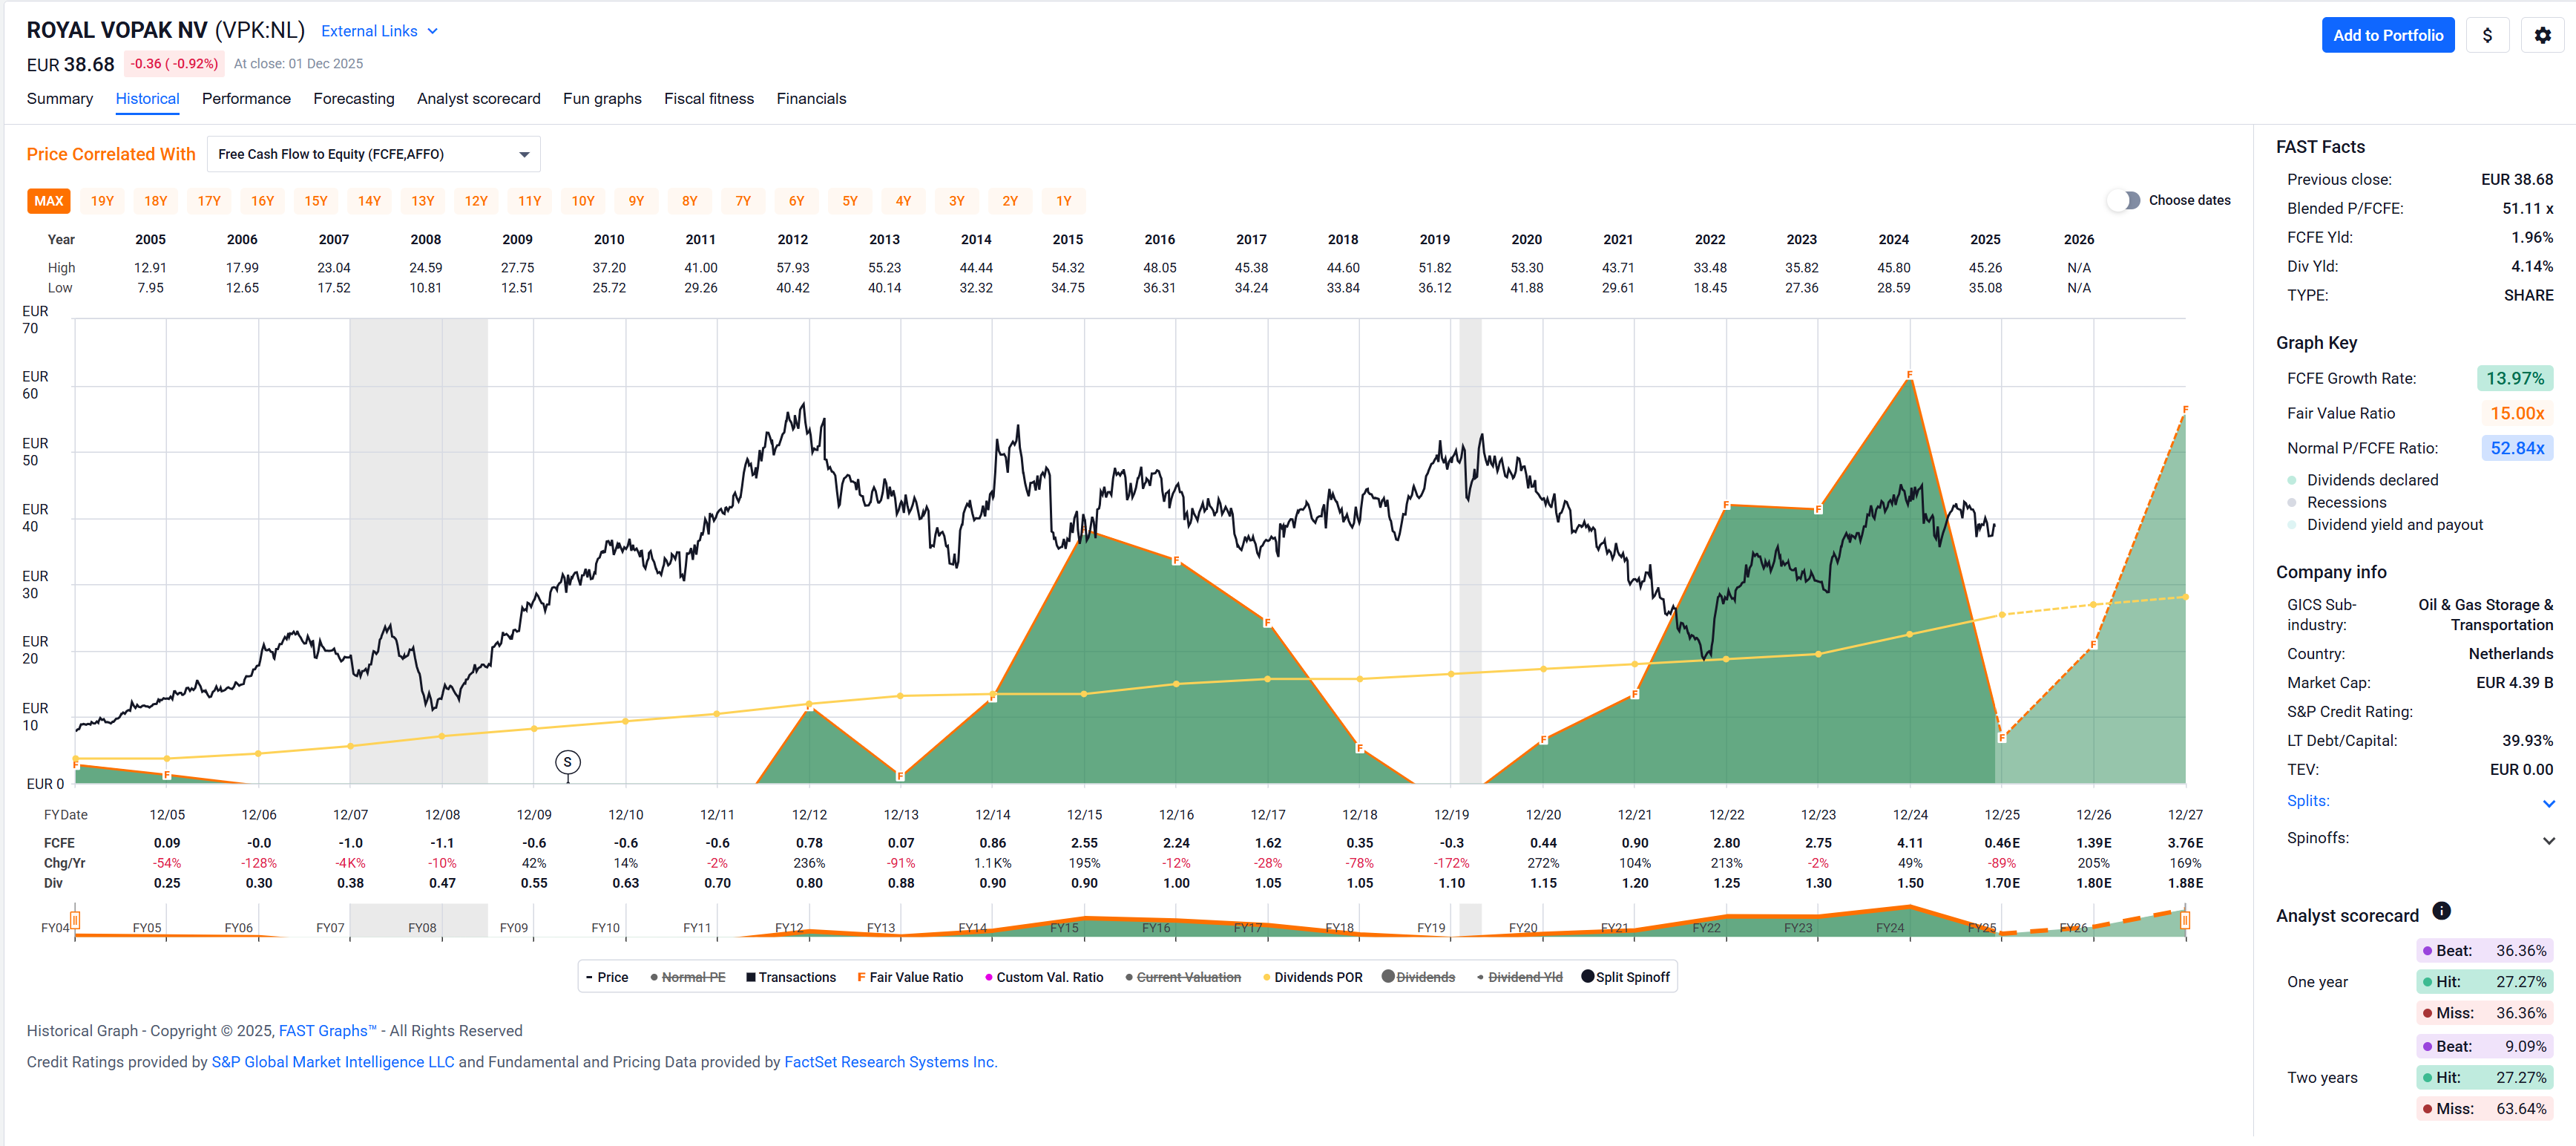
)
$ According to this blog post “The FAST Graphs blended P/E ratio (metric multiple) is based upon a weighted average of the most recent actual value and the closest forecast value.” I suppose the same applies to other metrics like OCF and FCF.
1 Like
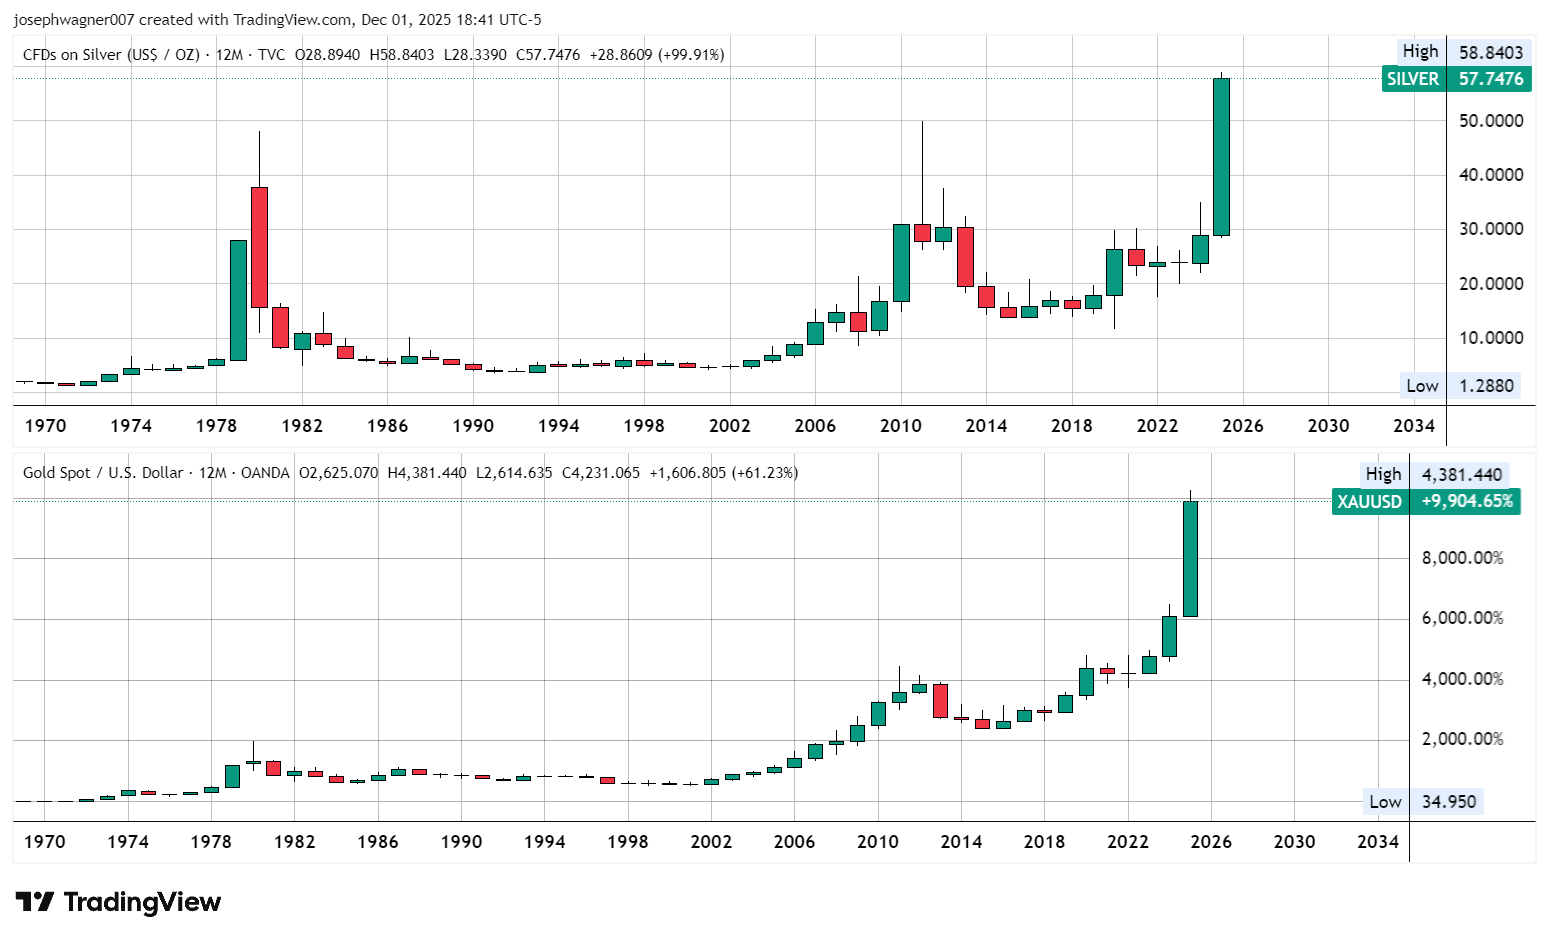
Stock price hasn’t gone anywhere in euros in 15y. A Swiss investor (CHF) would be just about flat (including dividends, but with FX loss) after 15 long years ![]()
As a european gas storage & transportation company they should be ripping since 2022, no, since we now buy LNG from Qatar and Donald via ports instead of Nordstream, but only a kind of slight recovery to early 2021 levels?
Is there more than meets the Fastgrapheye ![]() ?
?
Or is it a diamond that hasn’t been picked up yet?
1 Like
All fair points. Didn’t say I would buy them, just said I wouldn’t rule them out of my universe.
I’m kind of very picky on Energy companies anyways, so I’m not going line up on buying them today. But still, they fundamentally don’t look terrible, and their dividend track record appeals to me.
So, probably not a diamond hiding under an unturned rock, maybe a potential gem under a rock that’s already being turned.
As mentioned, I’m still a chicken on this kind of company … even though I have to admit that the dividend history – oh, did I already mention that? – seems tempting.
For professional courses on inconclusive advice please – for a small fee – subscribe to my substack.
![]()
2 Likes
Vopak: Just wanted to check the cash flow statement. Guess what, the company wants my details for allowing me to see it!
As they do not trade in U.S. markets there is no EDGAR and the only source of financial information would be the company itself. And they want my details which I kindly refuse to give them!
If they don’t want me to analyse their financials they either have something to hide (which would be bad) or just don’t want any additional investors (which could be good). For me it is just an additional argument for not trading or holding stocks that are not traded in New York markets.
As my captain momentum is converting me to an oil sheik probably that would be a nice addition. But no thanks, get yourself listed in New York and I may consider!
3 Likes
Some additional input, they have an active approach to share buy backs
- 6.3% taken in during 2024
- Additional 2.2% in 2025
The CFO recently (post Q3 earnings) described the stock as “undervalued” (trading at about 6x EBITDA vs. 11-12 for peers). This makes further share buybacks a realistic possibility (or, of course, being acquired by HAL - a PE firm - which already owns roughly 50% of the shares).
For transparency, I’ve written some short and longer term Put options on Vopak… I’ll either take delivery or just keep writing options and take the premium.
1 Like
RIP ARE stockholders
2 Likes
There goes ~$1000 of my annual income … ![]() … the market had sniffed it out over the year, Goofy was just dumb, chasing yield.
… the market had sniffed it out over the year, Goofy was just dumb, chasing yield.
At least ENB (in my portfolio) raised their dividend by 3% today, offsetting the 45% dividend cut by ARE significantly … ![]()