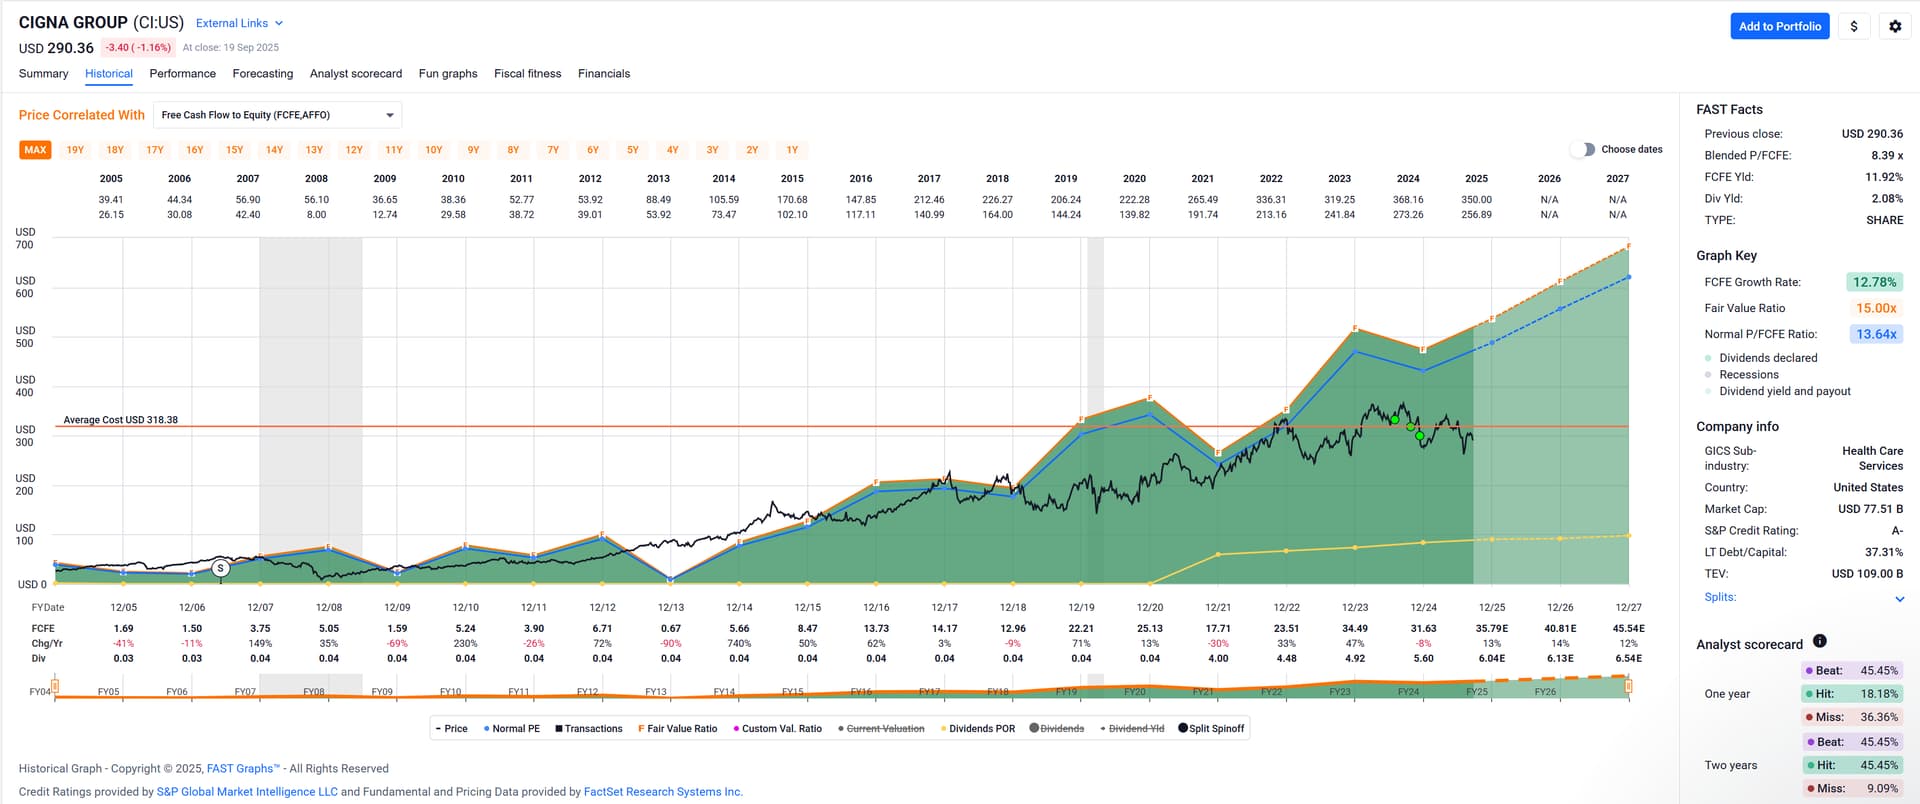
FASTgraphs scrolling through my holdings I often pause at Cigna.
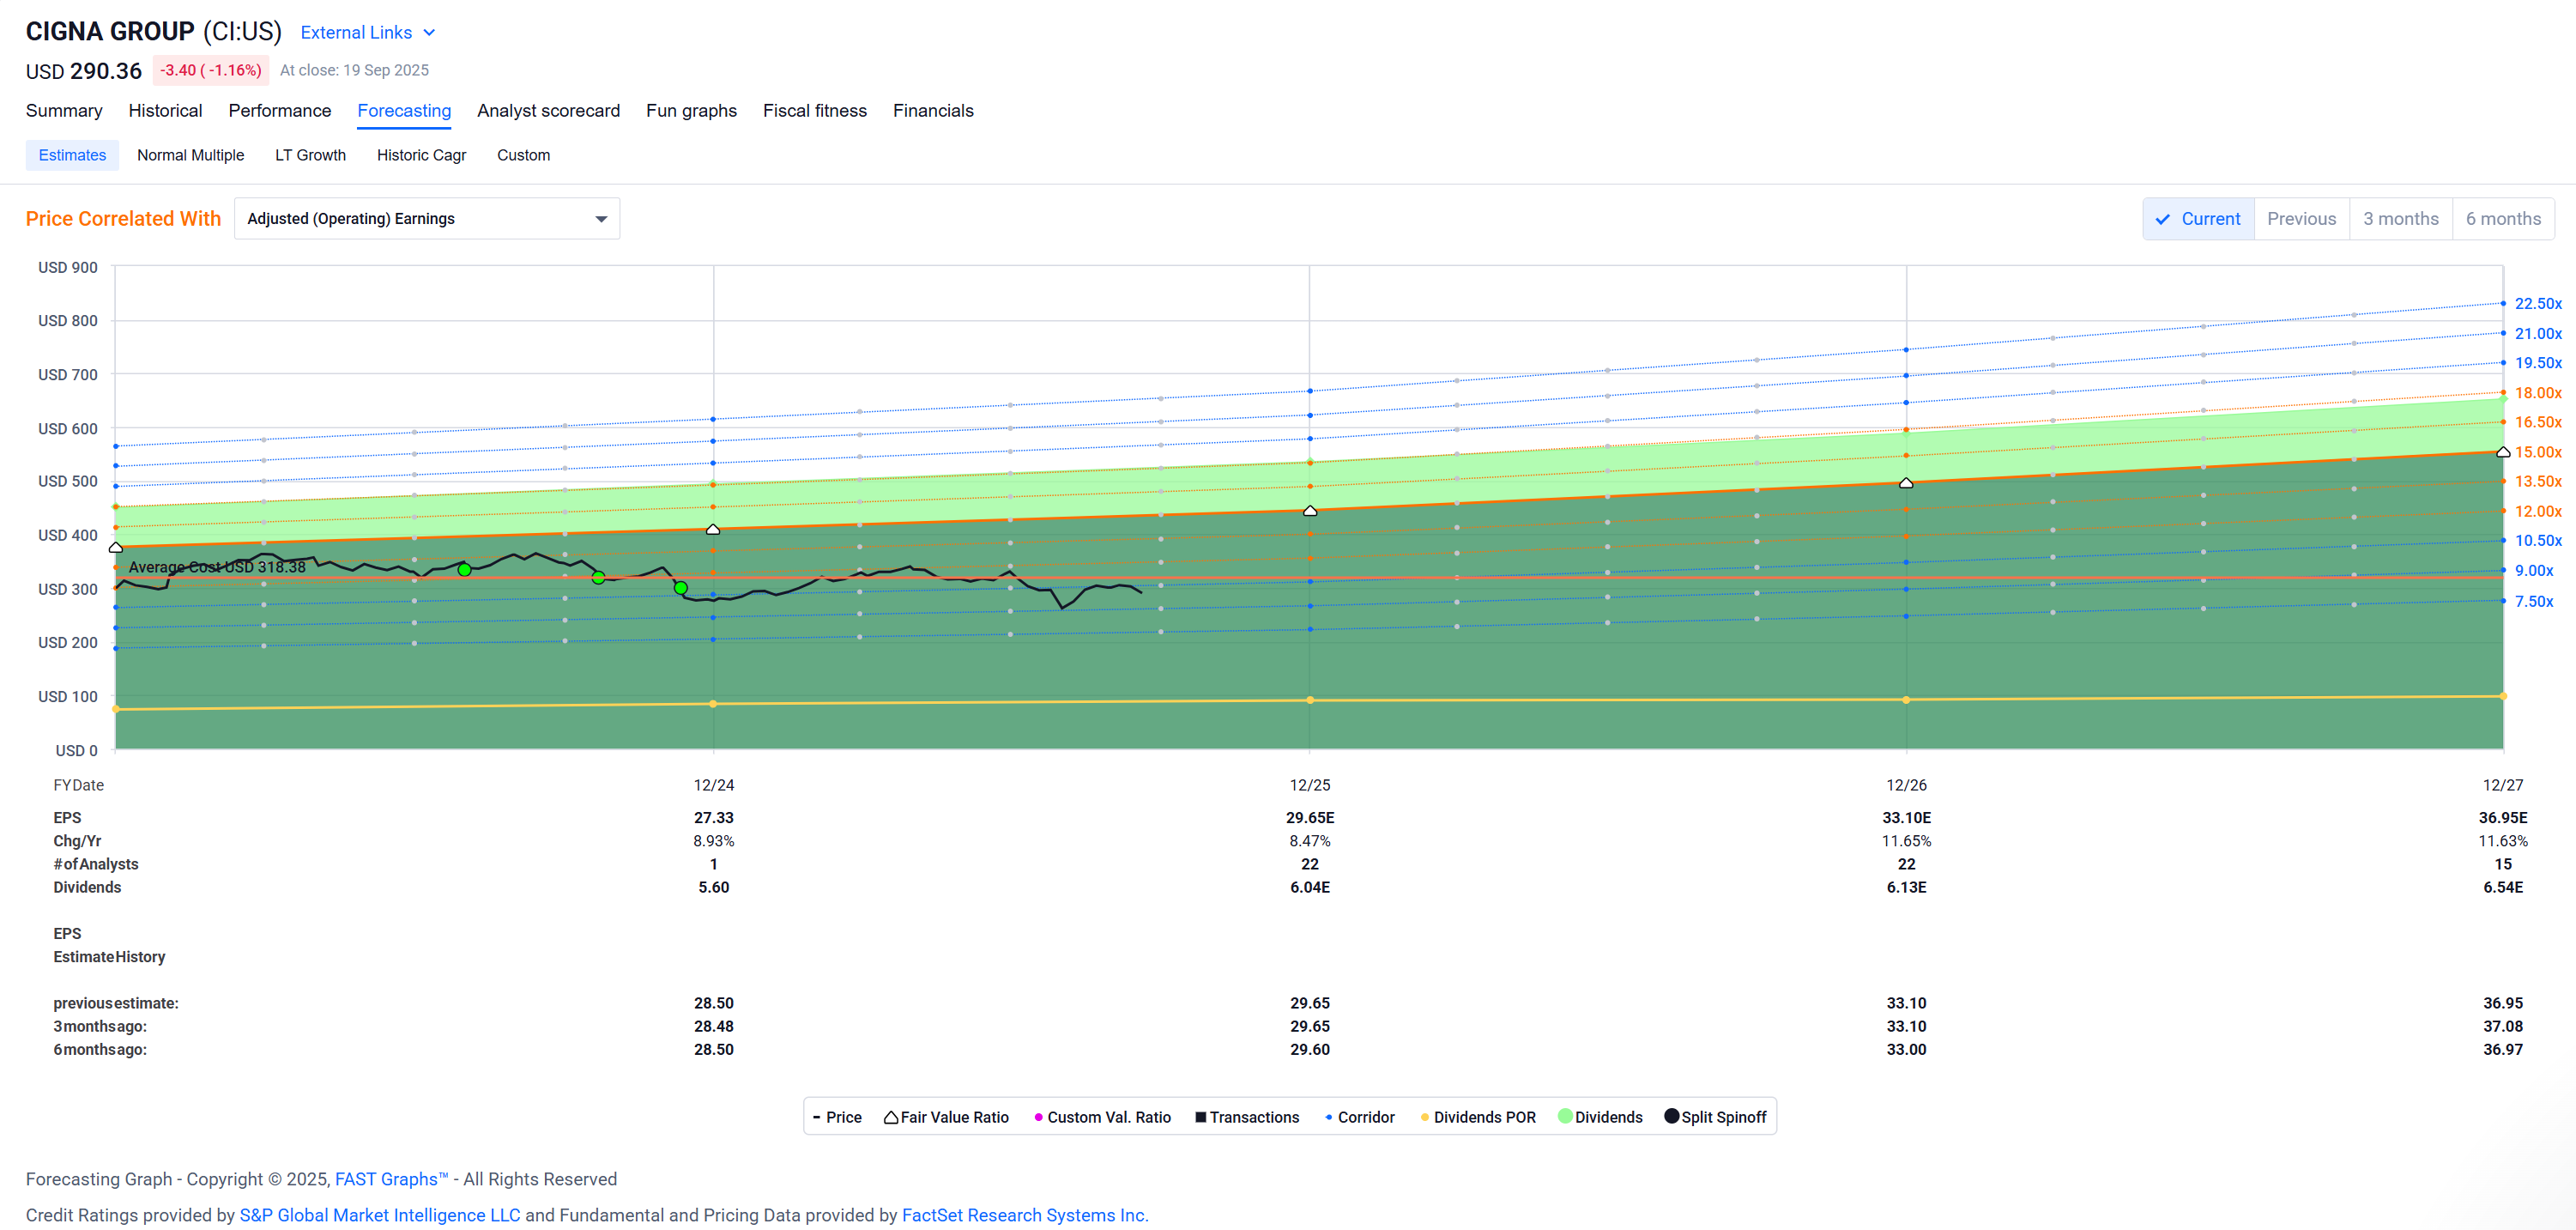
Textbook earnings graph.[$]
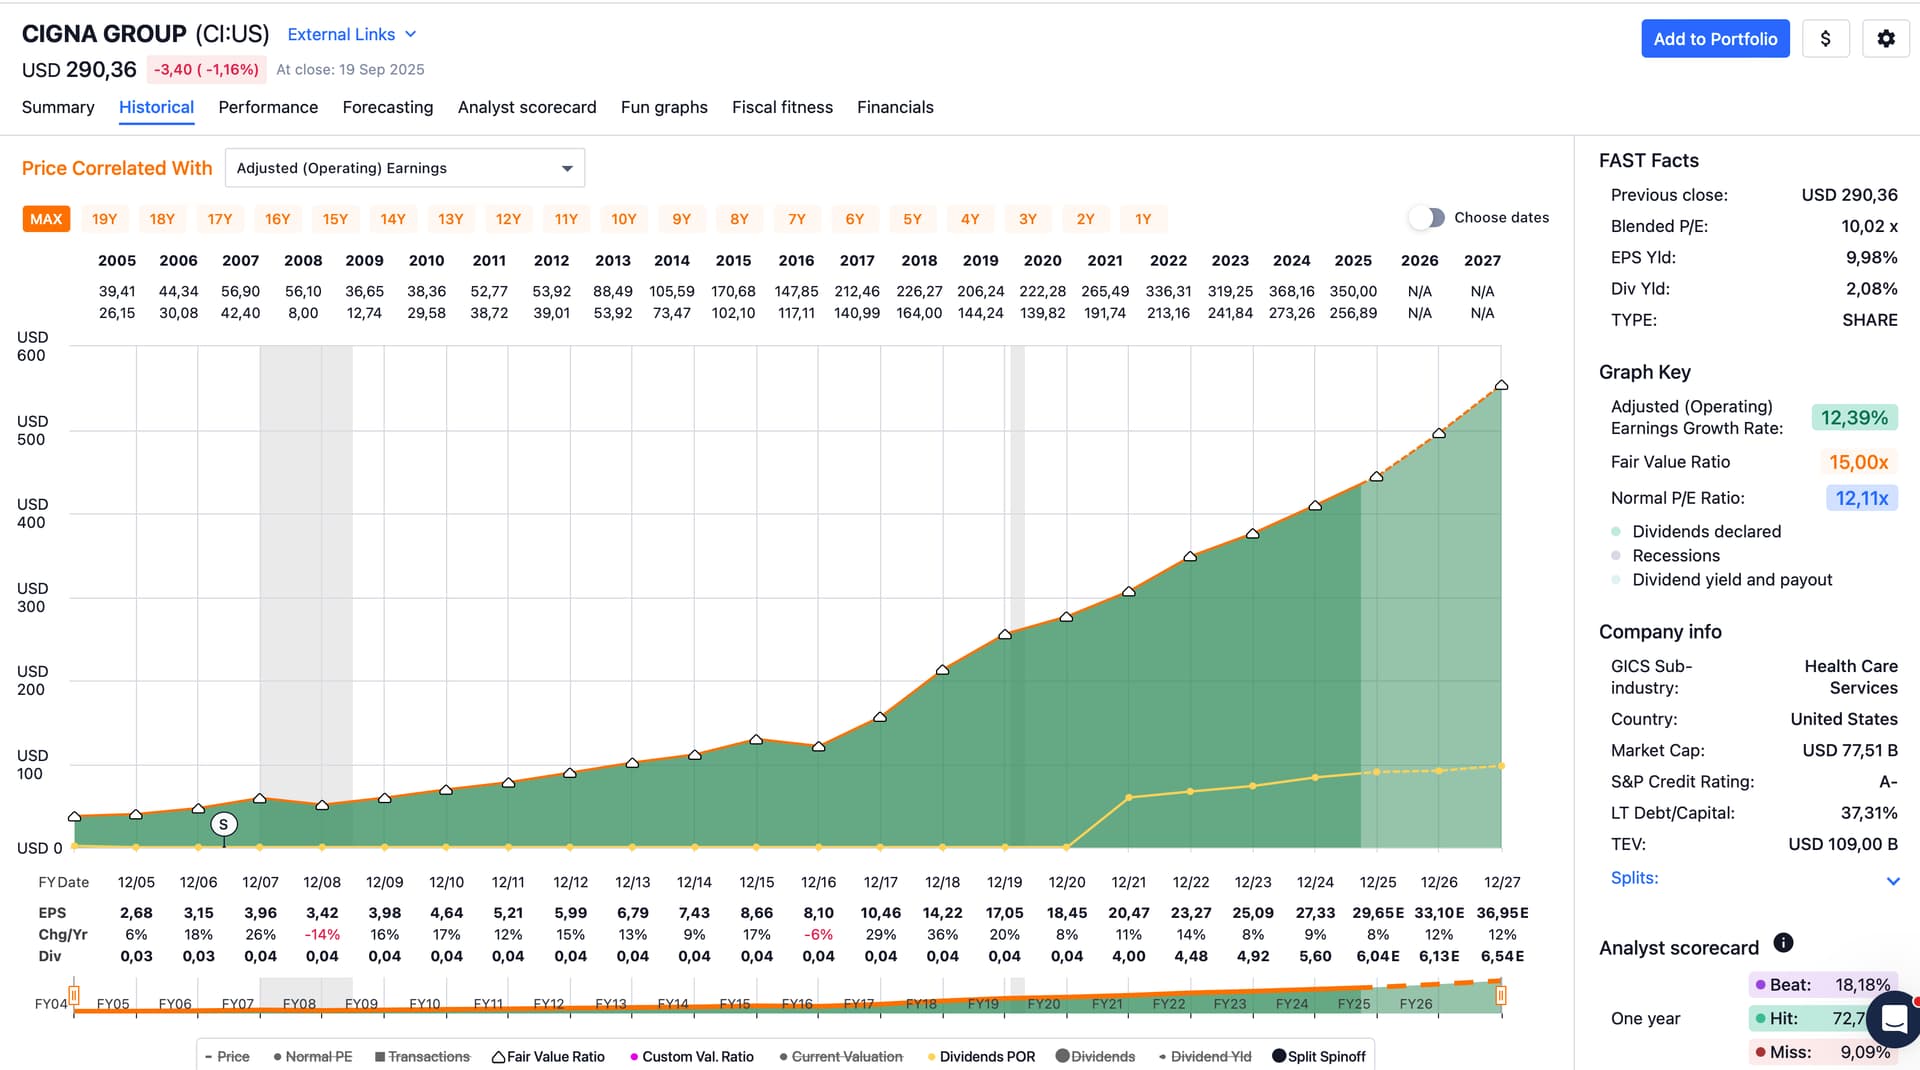
Only two down years in the past 20 years (2008 and 2016). Earnings growing at over 12% over the past 20 years. A- credit rating, acceptable debt.
Yet price continues to be depressed with a multiple of currently 10xPE.
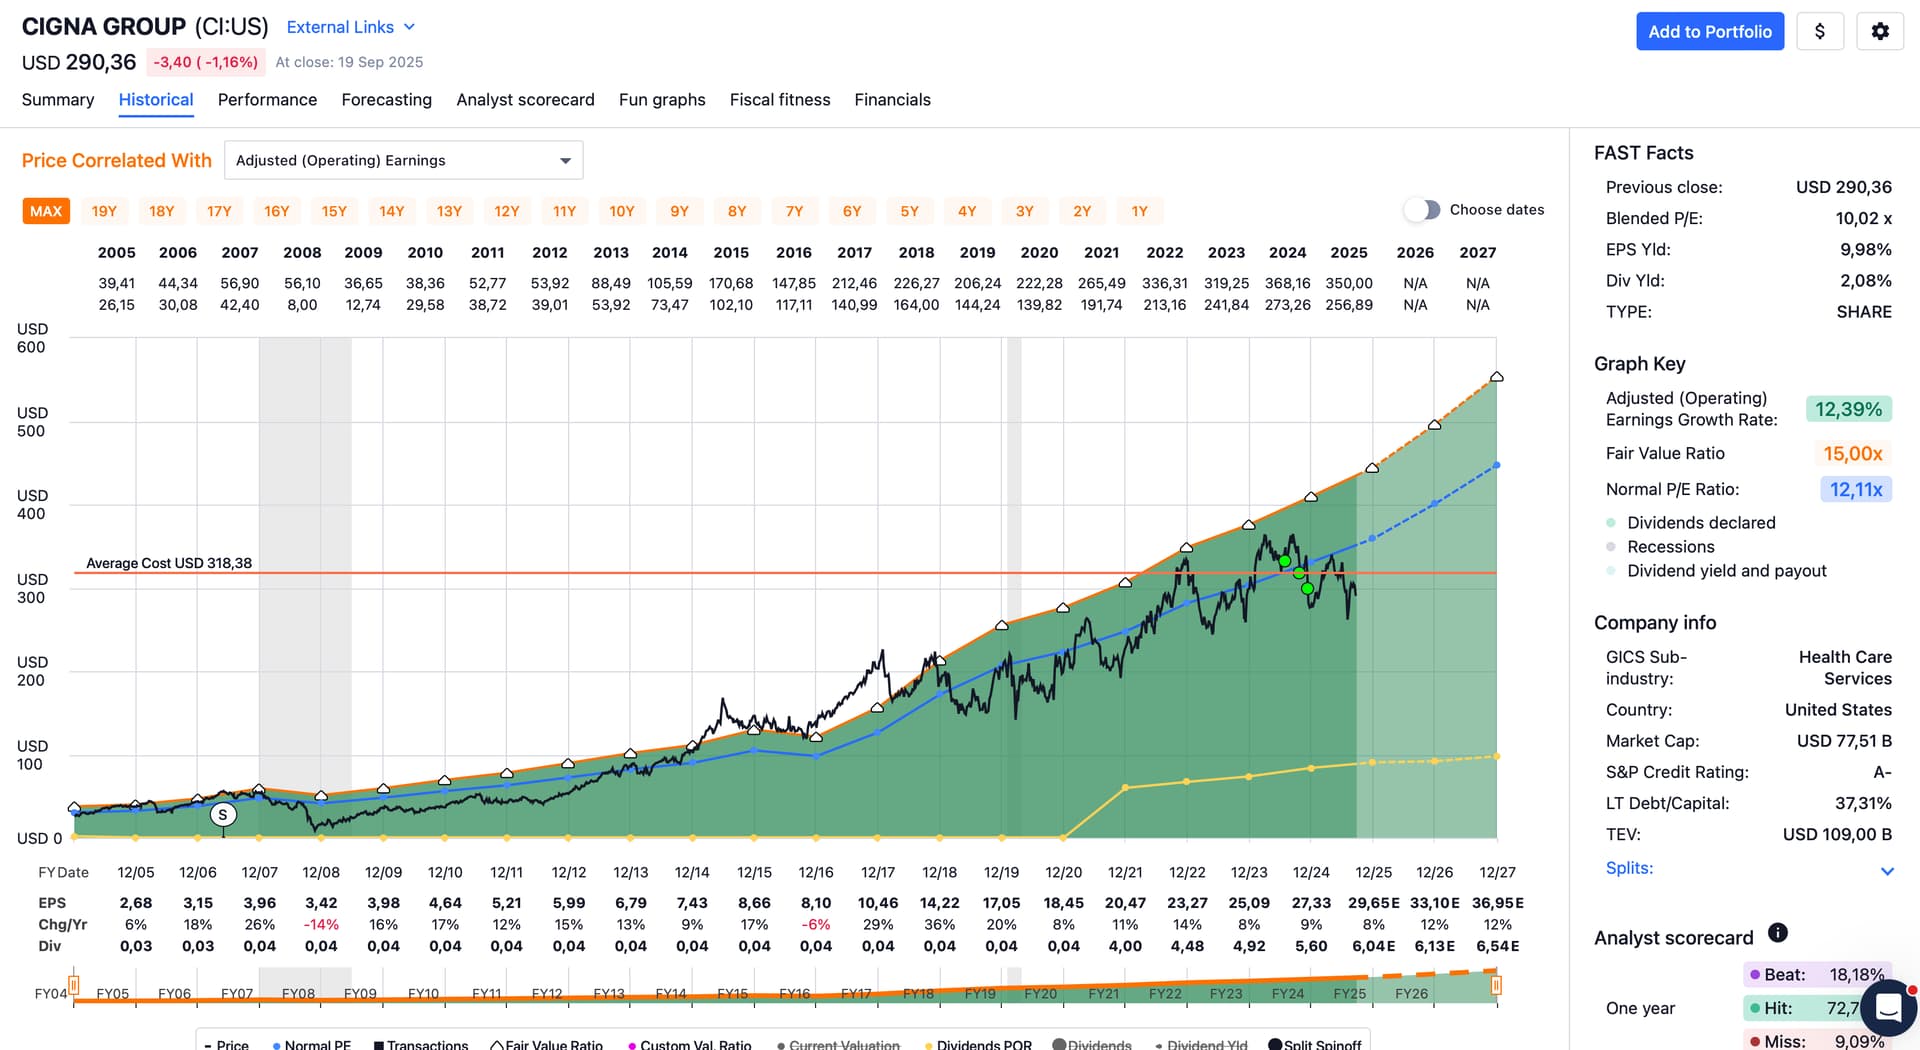
I wish their dividend was higher. I’d be ready to back up the truck …
Instead (due to the low dividend of just 2%) I’ll buy a smaller tranche as even if they stayed at their current multiple you could look at an over 12% CAGR over the next couple of years.
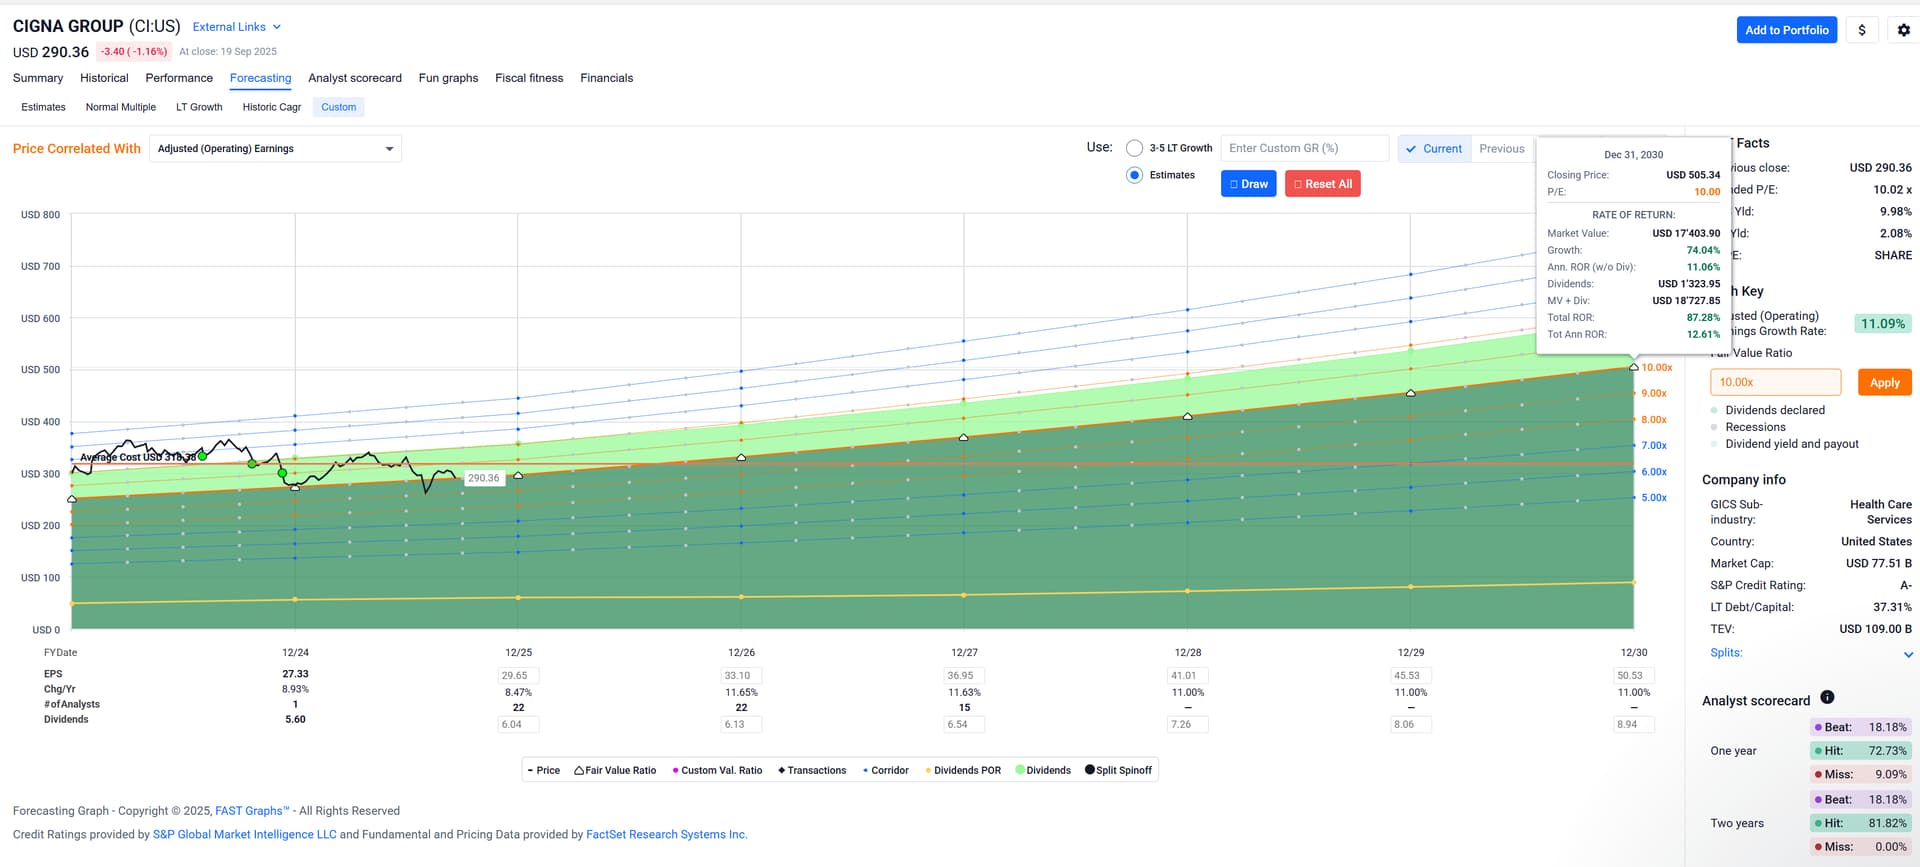
(y’all may call me a capital gains speculator now …
 )
)
I also like that their earnings estimates haven’t come down over the past 6 months.
Anyway, thought I’d share.
$ Their Free Cash Flow is a little more cyclical, but still plenty of cash coming in (for e.g. covering the dividend).