You hit me here, as I am a mechanical investor. I have not found a single strategy with MA (in its two dozen forms and in any timeframe) that has a real edge. All forward tests were just disastrous. Of course you find tons of strategies that would have worked in the past.
Now for bear markets there is just too little data to really find a strategy with an edge. I experienced 10 bear markets and, spoiled by the nice stock markets in this decade, did use my “crash recovery strategy” the last 3 bear markets. It worked 3 out of 3 times and that is not statistically relevant. It is a game I am OK to play.
I add some risk, but not deadly risk. It did work the last 3 times and made me a really nice pile of cash, but it may be a disaster this time. It is just a martingale with an emergency stop. Don’t do this at home!
If it works I will make a shitton of money… for my heirs. If not they get a little less. For me… as long as I can have “almuerzo” with my friends every morning when I am in Spain I am satisfied!
There are structured products where you can trade the VIX for example. With or without leverage, available on swiss exchanges, issued by a swiss bank. Otherwise you could buy a straddle (long put & call option at same strike) hoping for larger moves (volatility) and not direction.
Thanks, I’ve tried to look into that but I don’t understand the structured products at all, and options also feel too scary to execute (besides not having found them on PostFinance, if they’re even there), whereas buying/selling based on a simple graph which can, at worst, go to zero, feels more in my ballpark. Would be good to hear an example of a structured product so I can start having a better look.
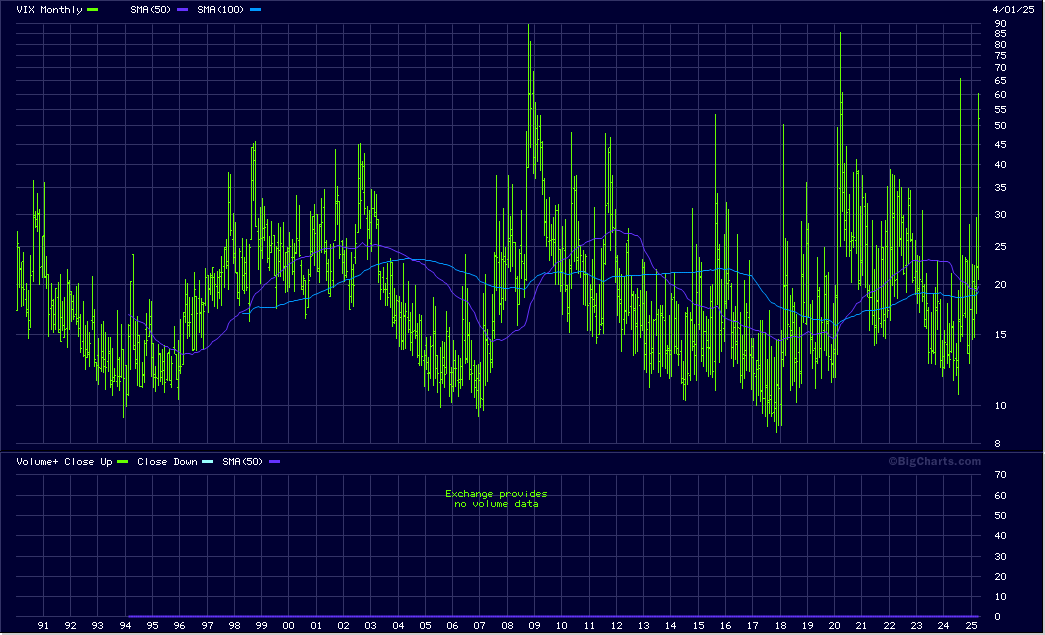
The VIX measures (or in form of the future trades) the implied volatility of all SP500 stock options.
I have seen many strategies trading the VIX, it seems too easy if you just look at the chart. I did not and will never trade it directly. But it gives some indication of what the option traders think of the market.
UBS has some good brochures on structured products, they are not that complicated (leverage products at least). Mini futures are similar to how a mortgage works in terms of leverage and factor (or constant leverage, same thing) certificates are basically the same as these 2x or 3x leveraged index products popular in the US. Both these product types allow you to trade the VIX.
Instead of using options (if they don’t exist on postfinance, don’t really know) you can use warrants which are very similar, but are issued by banks (quite a few swiss banks actually) and they make the market. Prices are the same as options, just you can not go short warrants but only long and the contract sizes are much smaller requiring less capital. Therefore a straddle is possible to implement, more complex structures that involve buying and selling options not.
How to find these products? Best go to one of the banks sites (UBS, Vontobel also has VIX, Julius Bär, ZKB) and check out what they have. In my experience the banks are also very helpful when you have questions and I acquired a fair bit of knowledge through them.
This thread is about market timing, not about very strange bonds with strange terms and a high risk that is not compensated by the issuer. Most of that structured products are exactly that.
Now, if you really would want to trade the VIX just use the future. But as I said, the VIX is just one of my gauges for market timing in a bear market. I like to see the future many months in contango. Like to dance the contango…
A few years ago a very popular VIX derivative went broke, leaving all the investors with their millions in booked gains in the rain.
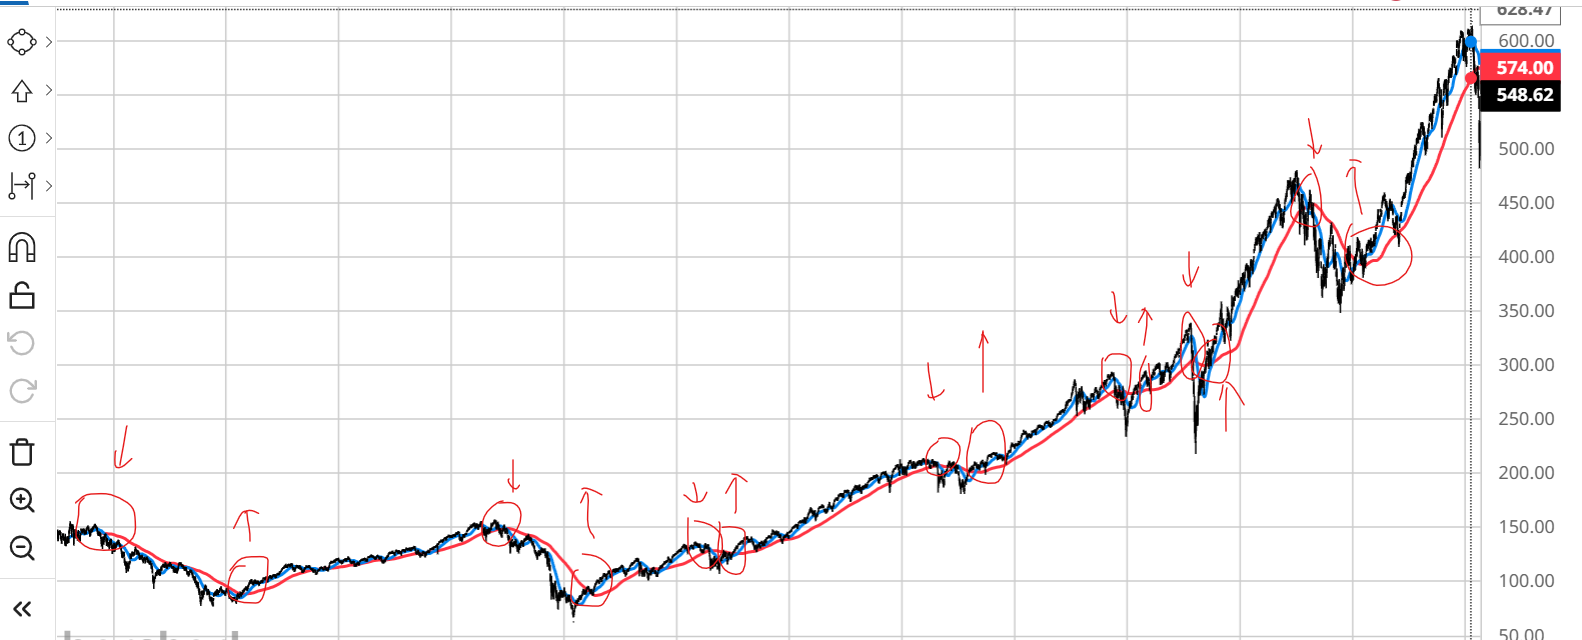
The slippery slope of market timing and technical analysis voodoo suggests we’re in for a death cross soon, frankly plotting the last 25 years of the SPY (1/1/2000 starting date, ending today) with the 50 (blue) and 200SMA (red) looks insanely consistent, to levels of too good to be true, missing the worst of bears and getting in pretty well during bulls…
at the peril of being banned for TA I took some inspiration from your drawing.
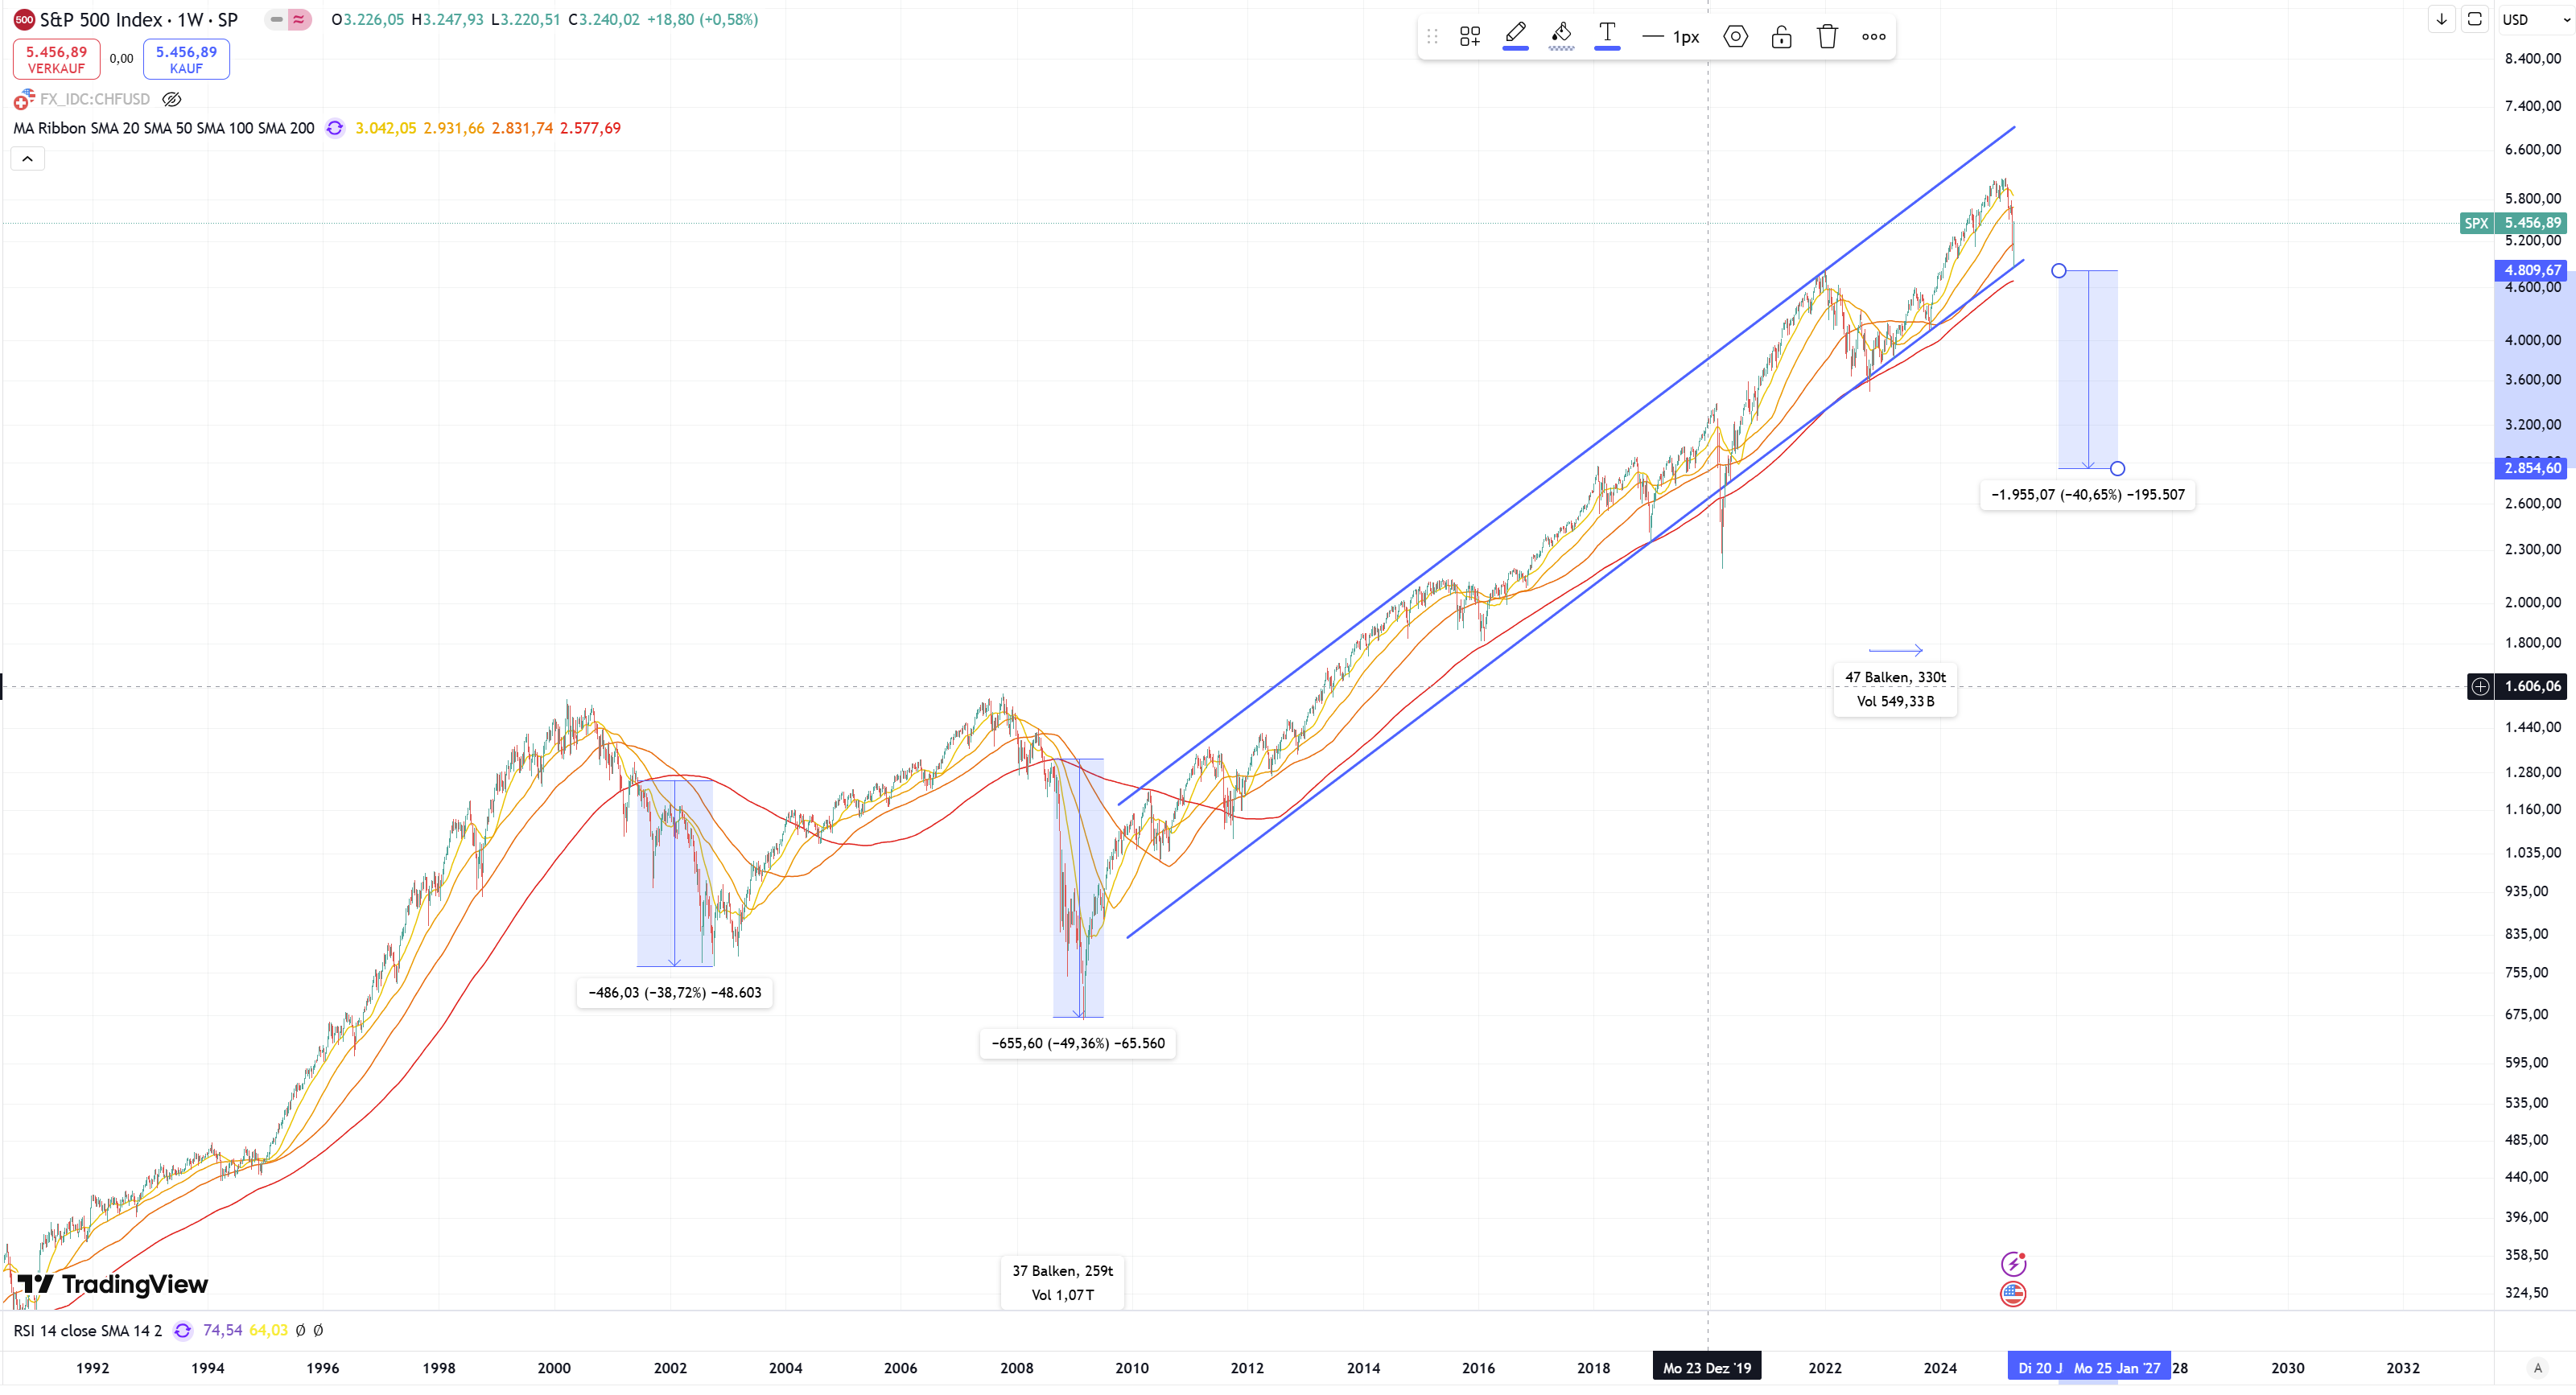
We really only had 2 weekly death-crosses in the past 25 years, they both made the market drop 40-ish percent from the point of the cross (20MA/200MA). If the same happened, the 40% drop from the base would leave us around 3k SP500
If Mr. Orange will stabilize the situation this might have been the third very good oppty to buy stocks, on a decade-scale. If not, we’re all doomed Faites vos jeux!
I mean…can it (momentum trading) be that easy? To me it looks too good to be true, yet the data are there for anyone to see. That said, I am aware that any strategy loses its edge when it’s discovered as more people are doing it, but this Achilles heel may be missing here because this is basically slightly more active than riding the wave, and going with the flow of the many (sellers/buyers).
Why might have been? There hasn’t been any cross yet. @Dr.PI we could have these posts in the market timer’s thread?
“People react too much to short-term things,” Buffett once said on CNBC. He added that he avoids distractions on purpose. Buffett doesn’t keep a smartphone. He avoids reading emails all day, and the “breathless” commentary on business programs doesn’t throw him off his game.
Buffett wrote in his 2017 shareholders letter, “Your mind may well be rattled by scary headlines … and an unsettled mind will not make good decisions.”
I mean, Trump’s trying to upend the current neoliberal world order.
I am pretty sure he won’t be able to (as he has neither the support nor the brain nor the time to follow through in his tenure). But this might not just be a short term thing.
And if it ain’t, we better be watching and acting upon this.
Technically, you can, in hindsight … if you work for Hoolie during the Great Financial Crisis. The grants you once received – then options – went underwater, but the company graciously reprices the option grants, floating you above water again.
I remember at the time – completely financially illiterate – wondering how the company was pulling this off, but appreciating it (despite my grants from a couple of years earlier not being underwater IIRC) and keeping all those eggs in one basket for no good reason.
Not even market timing, simply ignorance!
Anyway, just an odd data point, please ignore, I still wanted to provide it.
If you’re more towards value investing and fundamentals it makes perfect sense after Graham’s quote that the market is a weighing machine in the long term.
So I did some digging yesterday and saw that, when following a “sell at death cross/rebuy at golden cross” strategy one gets:
Nov 2000 to May 2003: 33% organic portfolio growth, need to wait 31 months
Dec 2007 to June 2009: 40% growth, need to wait 19 months
Mar 2022 to Feb 2023: 6% growth, need to wait 11 months
Jan 2009 to Jan 2018: would basically not do anything meaningful other than miss the dips
Mar 2020 to Jul 2020: lost ~20%, missed the big dip and a good part of the v-shaped recovery - it really lost serious money and opportunity here, sold low to buy high
Sep 1998 to Dec 1998: lost ~10%
So not sure what to make of this, but I am sure people who spent more than the 30 mins I spent on it have plenty to say about the above numbers, with more accurate simulations which I’ll do purely for fun. First impressions are:
this appears to work in deep, gradual and protracted crises
this can lose money in fast-moving situations
These make perfect sense given that both the 50 and 200 SMA are longer-term trends, and if I were to employ this method I’d look to ignore any crosses happening within 3-6 months of each other.
one would need an iron stomach to really wait at least 1.5 years sitting on their hands, while they’d be getting greedier and greedier
one would need a steel stomach to really sell any sizeable % of their portfolio following the crosses, I feel buying is a much easier decision
it doesn’t take into account dividends
I’d need to simulate with actual numbers, # of shares starting and finishing, dividends, vs buy and hold, vs buying the dip. I don’t have the skills to do this in a smart way so it’d need to be with pen and paper, but I’m on leave next week and this is a fun exercise.
Bottom line, I’d like to try it with a small leveraged position, but know I wouldn’t have the guts to do it with my main portfolio.
Edit: all numbers based on the SPDR S&P500 ETF as the oldest ETF, used barchart; I am sure this has been done better a few thousand times already, but to really internalise these things I need to do them with my own hands.
Looks like it’s a 25.5 years period, and being out of the market 103 months seems unreasonable at first glance but it’s just a glance. Otherwise it look like a lot of trouble and risk for mistakes for borderline suboptimal return.
Mit dem Lesen und der Teilnahme an diesem Forum bestätigst du, dass du die Forum-Richtlinien gelesen hast und damit einverstanden bist sowie den Haftungsausschluss auf http://www.mustachianpost.com/de/ akzeptierst.
")