It‘s just a few % that make up the total value, but that doesn‘t mean small caps don‘t outperform large caps for example. It‘s just that the total value of return is lower. The relative % can be the same or higher.
If MSFT for example outperforms, it‘s a huge % of the total performance of the market, because MSFT is just so big.
But if a small cap with 1B in mcw makes a 100% in a year, it‘s a tiny blip in the market cap weighted index.
I am a bit curious now what is the real chance based on math.
If N stocks exist, let’s say S&P 500… and let’s say there are 100 investors , each can pick max of 10 stocks. What is their chance of beating the average S&P 500 performance? Assuming TER is Zero as we are talking about retail folks.
I found something … worth a read. Doesn’t answer the question yet
Hahaha, you also have just did it . Anyone wants to tell about a friend who has lost lifetime savings in day trading? I wonder why these people never talk about it ?
P.S. I did lose 10+k in trading in the past. No strategy, too much leverage, …, total loss!
I know someone who did the same. Life savings in a company that did outrageously well, coudn’t stop talking about it, wouldn’t diversity. The company was a supplier to Apple who later dropped them and then company tanked. The guy lost everything. It affected him badly and he became depressed.
In my active investment days, I bought NVDA at 500 USD (before split), it went up 15% in 1-2 weeks. I thought this is too much and I decided to book profits. I guess I don’t have to tell you how good this trade was (or was not) …. That was the period when I understood that it’s not my forte to pick stocks
Eh oh well, you’re still a winner. Even 0.01 CHF is a win.
I put 2000 in nVidia and Lilly in Feb’23 and sold in Dec '23. It fully funded a family holiday in Paris and made a point to my spouse that “looking at numbers” (as she calls it) is meaningful.
Not a stock picker either, just BRK.B, and definitely not active but buy and hold. As Dr Pi said above, one can achieve a lot with little effort. In fact since end of 2023 (I am only into this since 2022) all my “looking at numbers” is purely for fun’s sake. For example I’ve projected how dividends from VWRL will go from covering my account and trading costs, to buying more BRK.B, to funding a few months’ rent per year, to eventually being part of my retirement income, hopefully without ever needing to go to high-yield ETFs.
Going back to the topic. More or less. Not the performance of active investors, but it has numbers on how much of stocks survive and how much and how die. Like I am always saying, nobody wants to talk about failed investments. Well, here you can see many specific examples (not Enron).
I know I am being repetitive, but this kind of wisdom is worth repeating. And this one is also funny, besides being informative. I didn’t know, for example, that ARKK exists for more than almost 10 years, huh.
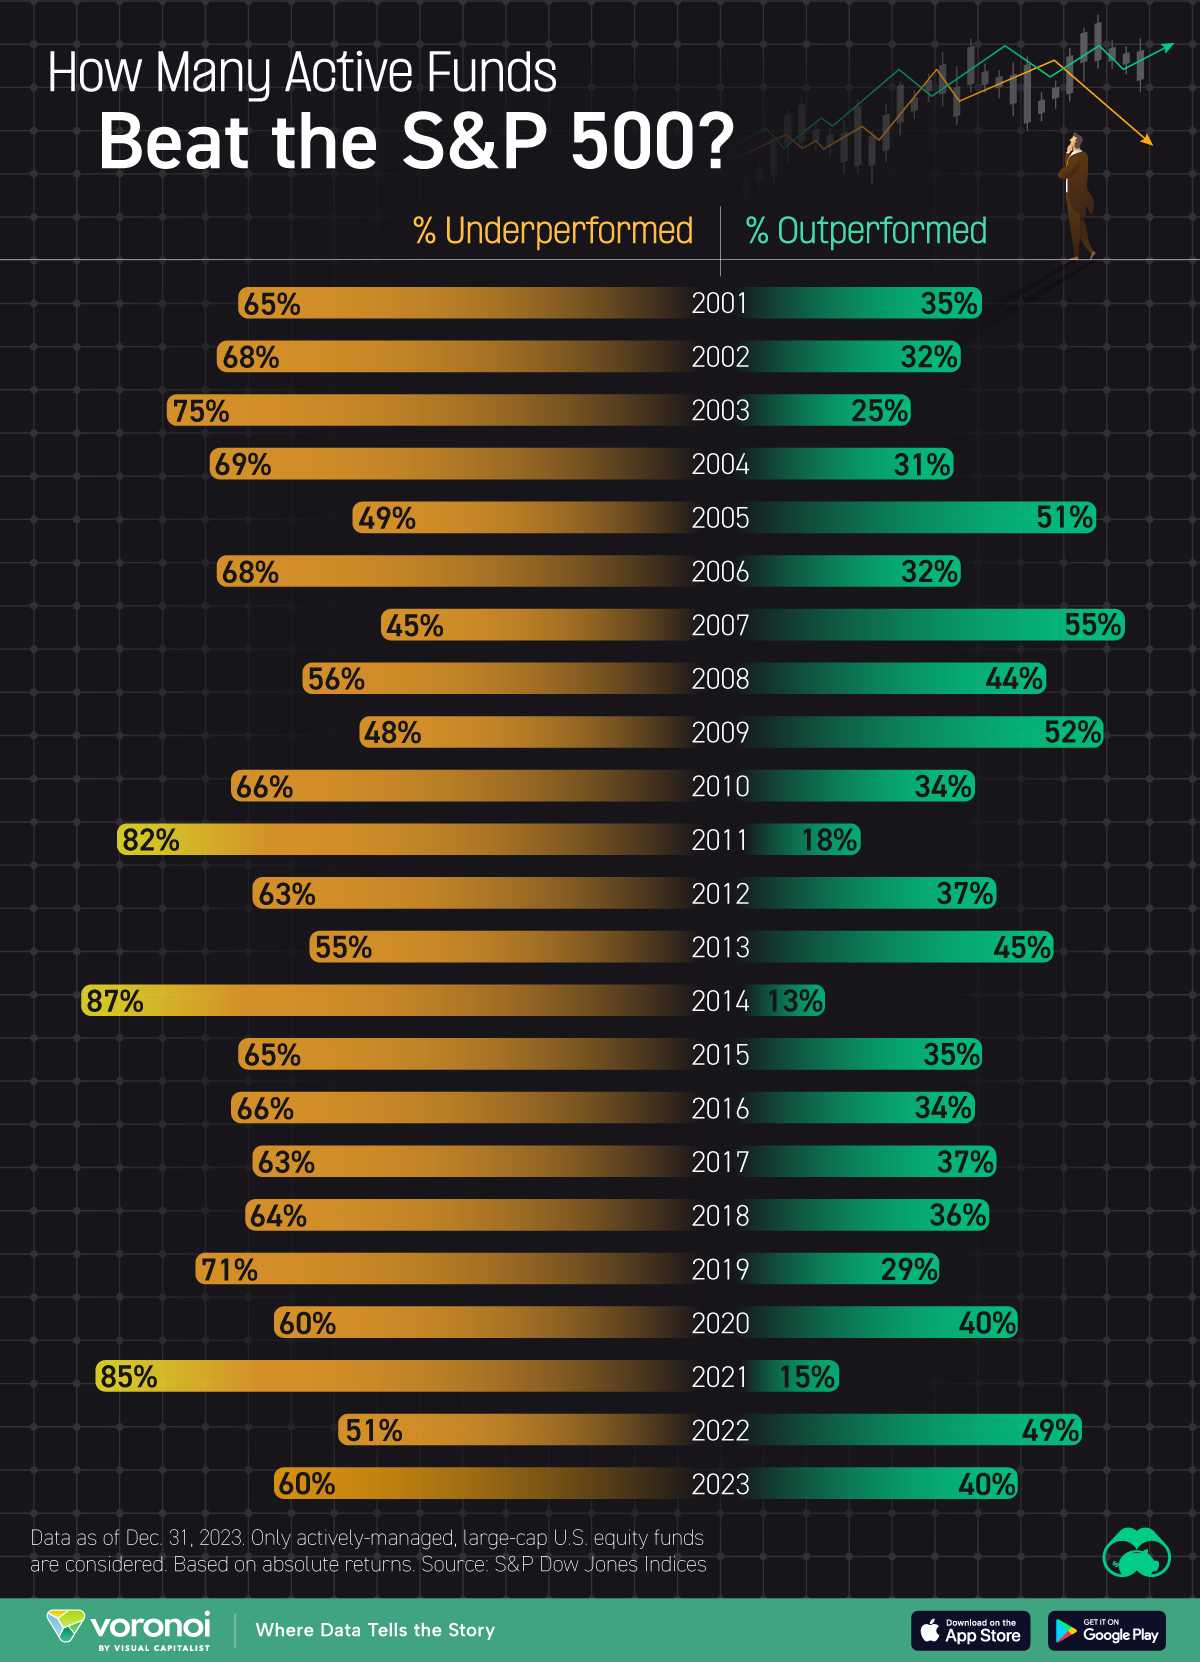
That’s interesting. Somewhat contrarian view: that’s far from the “90% of active funds underperform the S&P500” that I’d taken as gospel to date.
Fees are in or out of the calculation? The article doesn’t say, it could skew the numbers more if it’s the 2+20 fee structure of most hedge funds. 2011, 2014 and 2021 are heavily in favour of passive funds, but the others aren’t THAT bad, to be honest. Also bearing in mind there were some cracking years post 2012, active funds beating the index in those years would have made phenomenal returns pre fees.
Also another point to pick is that this is a collection single data points, not a continuum, so it doesn’t represent compounding. Investors could be jumping in and out, funds could “reset” (like the Medallion Fund does).
What I’m saying is that although I’d been conditioned to the usual gospel this infographic could be picked sliced and diced in many ways.
Another key point is that very high NW individuals may not be out to beat anything, other than inflation, so there’s that angle too. I recall a reddit post where a poster was incensed that his rich parents had a >10mn portfolio with an active manager for 20+years which did 4% per year. Was crying about being robbed of their inheritance because it wasn’t “VOO and chill”. Both I and other posters told him to stop being a crying little greedy piggy, that their parents’ manager beat the market for the lost decade, and he’s rich already. Greedy piggy.
Edit: fuck’s sake, even if the poster wasn’t fishing for reddit karma it’s still obscene, hopefully his parents gave all to charity, wouldn’t that be fun?
Not sure whether these are stock only funds, or are some of these 60/40 stock/bonds.
Also since, S&P500 has been one of the best performing markets in the last few years, any kind of diversification would likely lead to under-performance e.g. non-US component.
It would be interesting to see comparison to big cap US funds.
Whilst I agree with the conclusion, I don‘t agree with the above stats. Notwithstanding „active“ Index huggers, the argument could be made that an active funds benchmark was the equal weighted S&P. And there, the situation was a bit more in favor of the active funds.
I think that active funds have a tiny edge over completely dumb money from people that play casino. But still, active investing is just not worth it…
You are not implying that 0.03% p.a. fee of a typical total US stocks market ETF would make a difference, right?
I did some quick calculations. The average of % of active funds overperforming per year is 36%. Let’s say it is a probability and it is uniform, no sequence of return risks and stuff like this. Now, my calculator tells me that a probability of overperformance in two years in a row is 13%, and 3 years in a row is 4.6%. Of course it’s not the same as overperforming after 3 years, but it will give you an idea how quickly the odds in your favor deteriorate with time. Exponential compounding is the real magic.
P.S. Actually I have nothing against active fund managers per se, but I have something against their fees. If you look a bit more on a global scale, that’s what is important, and maybe the most important long term. I wonder if a fund randomly picking every 3 months 100 stocks from S&P 500 and weighting them equally, but having the same level of fees as VOO, would have in 10 years a very similar return to VOO…
Mit dem Lesen und der Teilnahme an diesem Forum bestätigst du, dass du die Forum-Richtlinien gelesen hast und damit einverstanden bist sowie den Haftungsausschluss auf http://www.mustachianpost.com/de/ akzeptierst.