World market capitalisation by region/ country

Dear all,
as a world-wide-distributed passive index investor, i try to have my portfolio represent the market.

now the first reference i tought of was the numbers published by vanguard for their VT ETF.

now this is their portfolio, not the market. Do you have any sources that provides good numbers here? quickly googling gave me this with perfect excel compatibility. they seem to vary quite a bit from the VT numbers. I made a comparison here:

my first question is: does anybody know of a better source for numbers on the by-country market capitalisation?

my second question is: would anybody bother if VT deviates from what is the market?

What do you call “the market”?
On Vanguard website it is written that VT tracks the FTSE Global All Cap Index.
This index is described here.

As with most indexes it is Market cap weighted, which means that the more expensive a company becomes, the more you will buy of it. It is hard to find non-market cap weighted indexes.

1 Like

VT is quite good as representing the world weighted. However, China is under represented because VT doesn’t include all China stock for exemple China A share. Have a look at http://www.ftse.com/products/downloads/About_FTSE_China_Indices.pdf

Personally, I have bought some shares of Lyxor MSCI China A Fortune SG (DR) UCITS ETF (FR0011720911) to mitigate this issue. This fund is very illiquid, however it tracks the index: MSCI China A and not the MSCI China A international tracked by other providers.

1 Like

I agree, the FTSE GEIS Series is a great source of market cap data.

I made a small table with comparison:

Now, if you buy VT, then you cover almost all investable companies, 48 trillion dollar.

  • Do you know where can we find data for bonds?
  • What is the global market cap for bonds?
  • How many bonds should I buy if I would like to keep cap weight between stocks and bonds?
  • Vanguard offers the BND (USA) and BNDX (global ex. USA), what should be the cap weighted ratio?
  • How do the bond indexes work? Do they just multiply price times the number of issued bonds?
3 Likes

I googled a bit and found this. So according to this article, the global market value is $76 trillion for stocks and $38 trillion for bonds. But it does not correspond to what Wikipedia says.

Based on the incomplete data provided by BIS in Basel, the total debt market is $93 trillion, with $48 trillion for corporations and $44 trillion for government.

It looks like the total bond market is worth more than the stock market. I don’t know what to think about this.

Yes, As far as I know the bond market is much bigger than the stock market, see for instance here and here..

But even if that is the case, I would not reflect that in my asset allocation that would make grossly 66% bonds vs 33% stocks! Given the current bond situation, I think this would be very very risky (not much upside, risk of credit contraction…) but that is just my opinion.

1 Like

Hey @Julianek, thanks for your input. From your link, I guess this is an important point:

For one, and I think this is most important, the bond market includes government debt, in addition to traded company debt like GE. The stock market on the hand includes only equity of those companies which is the residual after you take out the debt from the total value of the company.

So bond market = corporate debt + government debt
And stock market = equity of corporations = assets - liabilities (bonds go here)

Now it makes sense to me, how bonds could be worth more than stocks. Let’s say I have a house worth 1’000’000, that’s my asset. But I also have a mortgage worth 800’000. So my equity is 200’000, 4x less than my “bonds”.

Let’s say the mortgage is for 1%, so it yields 8’000 annually. And I rent out the house for 3%, so 30’000 revenue. That means 22’000 net income. Now, would you invest in “me” (200’000) or in the mortgage that I have (800’000)?

Do not forget that “stock” only represent public companies.

All private equities are missing from the equation (private companies not quoted on a stock exchange)

Since private equities profitability tend to correlate with public stocks (a recession is a recession for everyone) you can theoretically adjust your overall allocation by increasing the stock part to reflect the private equity existing in the world

I can’t find the share of private equities in the global asset allocation

I0ve found this with the top ten private companies:
https://www.quora.com/What-are-the-top-ten-largest-privately-owned-companies-in-the-world
impressive, particularly aldi and lidl

2 Likes

Do you know which countries are represented under the umbrella of “Emerging Markets?” and in which weight?
image
I couldn’t find any information on Vanguard’s VT page
@nugget Maybe you know this since you were digging into VT as well

That’s simple. They are FTSE Emerging. The weight is proportional to the total market cap. As you can see from the factsheet, it’s $4.5 billion for Emerging. FTSE All-World has a cap of $45 billion, so Emerging is around 10% of it.

This is some pretty basic knowledge. Btw, VT is tracking the FTSE Global All Cap index, which also includes small caps, but the ratio remains ($5 bn / $50 bn).

1 Like

Is that international small-cap or US?

All countries weights are here:

And list of countries constituting EM is here:
https://www.bogleheads.org/wiki/FTSE_Emerging_Index#Country_constituents

Or alternatively, here’s the list of FTSE Global All Cap Index countries and here’s list of EM countries (according to FTSE).

Global. So BOTH.

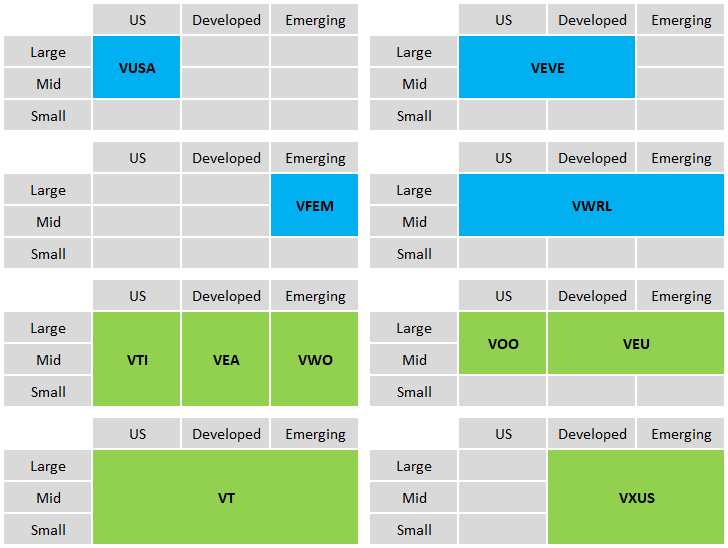
I made a cheat sheet here, I guess it’s also gonna be useful in the wiki. Blue are European ETFs, green are American.

3 Likes

Nice chart, maybe you can include VBR in US small caps and VSS world small caps
cheers

Why VBR (small caps value) and not VB (small caps)?

Good question… this is something I have been evaluating.
At first I thought about VBR because of the “higher quality” of companies in it but I was reading about the companies inside and they tend to be more mid-size than small caps + it has exposure to 868 Vs 1414 from VB.
Past performance is +/- the same long term but i found some other benefits on VB, TER is lower 0.05% Vs 0.07% and liquidity is higher on VB (much bigger ETF).

I think I’ll change VBR for VB.

1 Like

FYI, VEA is Developed ex-US, all cap (in case you want to update the cheatsheet). And VEU is like VXUS (but excludes small cap).

I have already corrected this mistake in the wiki, but I forgot it was here too. Thanks!

Remove the picture and make a link to wiki instead.