When to invest?

First of all, I know the Mustachian answer to that question is “as soon as possible!”, but hear me out.

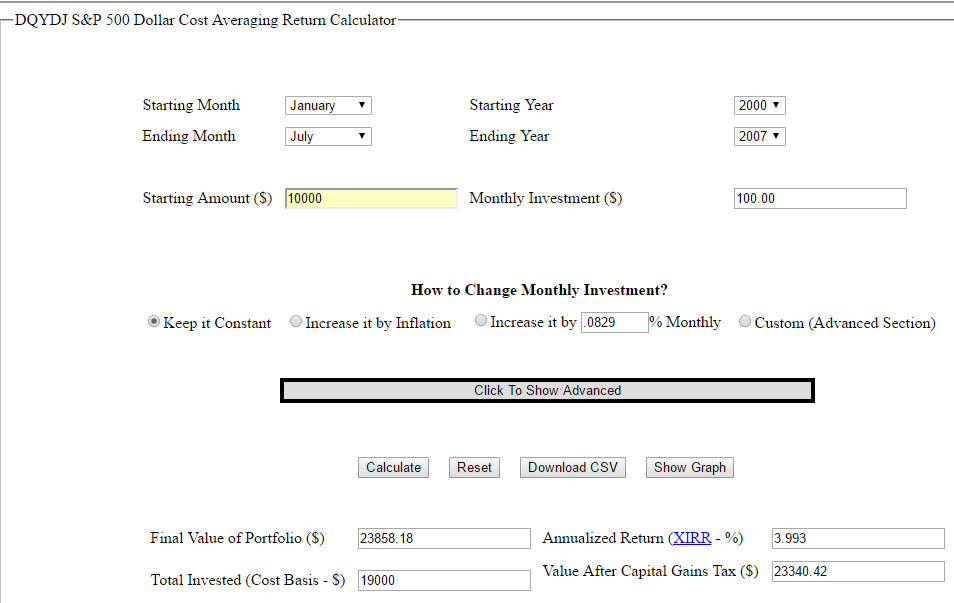
I have a bunch of cash sitting around waiting to be converted into ETFs, but I’m a bit nervous at doing it all in one go because of the current market situation. Both ETFs (IWDA and EIMI) are basically at their 1-year high, so I wouldn’t want to put in a bunch of money just to watch it drop in a couple of months. So far I’ve been buying “small” amounts every 3 months, but each time the price is higher so I probably should just have gone all in at the beginning.

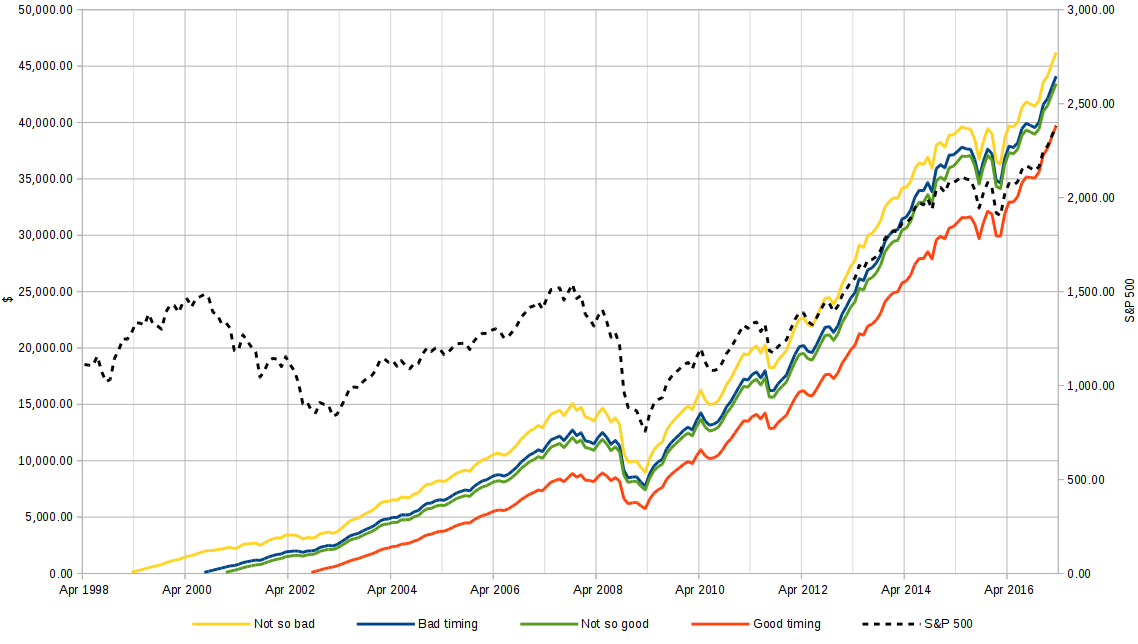
I know, market timing is bad, over the long run it won’t matter if the market drops in two months, etc. But still, the psychological fear is there… How do you guys deal with this? What should I do, just make the trades and not look at the account for then next 6 months?

3 Likes

Not investing because of all-time-hights results in not investing alot.

I deal with it by stoically following my Personal Investment plan.

It is not weakness If you cannot stand a drawdown for psychological rasons but honesty to yourself. then you should adjust your asset allocation such that you could stand the expected drawdown. but don’t do that during the crash that is certainly to come sooner or later^^

btw there is tons of threads in the MMM forum about this topic. browse there a bit is my advice :slight_smile:

1 Like

I’m not feeling very comfortable buying now too, market is quite pricey by most metrics and March correction was tiny. But i’m still trying to stay mostly fully invested, with a modest holding of a couple of month’s salary in cash and unused margin ready to buy into the next big dip.

Trying to buy safer stocks/sectors with spare cash these days - low beta and non-cyclical stocks (staples, healthcare, utilities) with good fundamentals, rather than whole market.

1 Like

Its not easy to know in advance how you will emotionally react to a big drop like in 2008 and previous ones. For the ones of us who are lucky to have gone through them before maybe there’s a better chance of knowing how it feels like in the roller-coaster…

Having said that, my advice would be to:

  • decide on your timeline, is it 10, 15, 20 years that you will buy and hold for? decide on a date, print it out, write it down, make a contract with yourself to not sell or do anything before this date
  • buy every 3 or 6 months in smaller amounts (to establish the habit over many years)
  • don’t look at the current value, track your portfolio in the amount of posts you have instead (they will always grow :smile: ) if you want to have an overview of the actual value, maybe you can include other asset classets (if you have any) to balance it a bit (any property, bonds, cash etc.) so that it doesn’t look so radical when there is a big drop
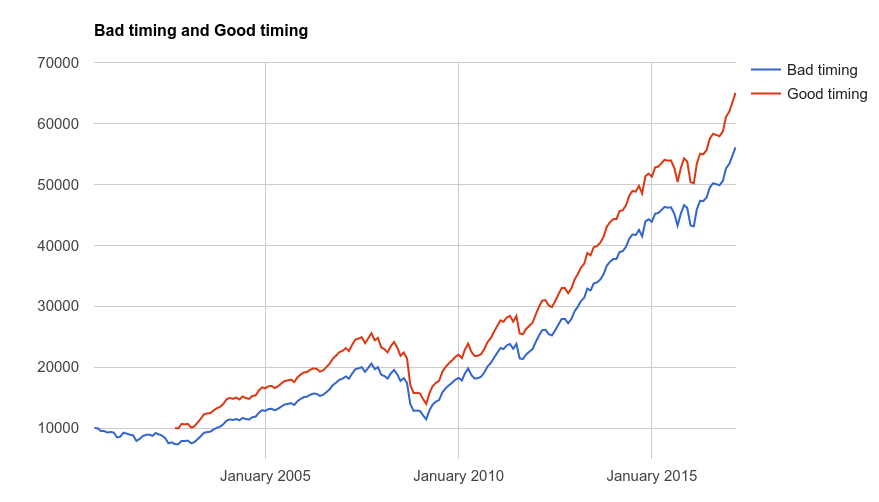
  • next time you think about market timing, have a look at the graph @nugget posted above

Hope it helps!

3 Likes

I’m not talking about not investing, I’m talking about doing it at the historical peaks. For example, say you started investing in the S&P500 with $10.000 and added $100 (inflation adjusted) a month. Now say you started doing this in August of 2000, the highest peak at that time, or in September 2002, around the lowest point of the .com crash. Here’s what that would look like:

(Simulation generated from this wonderful page)

So, even though you invested 2 years later, you would have made almost 3% p.a. more. Sure, you don’t actually loose money either way, but still…

I’ve already been investing small amounts even if the prices are at all-time peaks, but I have quite some cash that I’d like to put in the market. I would rather put it all in when the markets are down, though, as that will have a bigger impact over time.

1 Like

Well, investing at peaks still obviously cripples your returns. S&P had 30-50% drawdowns at crisis times - if you would have simply waited and invested the money post recession you’d make twice as much on it. It’s difficult to impossible to predict of course when is a market top and when is a bottom.

My current strategy to stay fully invested at market top while limiting risk, as I already mentioned, is to invest in the sectors that historically have suffered the least during recessions: staples, healthcare and utilities. They’ll go down all right with the rest of market when shit hits the fan, but hopefully not as a hard as the more cyclical industries.

1 Like

I’ve been doing more simulations and I realized that the issue here is the $10.000 lump sum at the beginning, which skews the results heavily depending on the timing. If you start from $0, then the earlier you start, the better.

Say you start investing $100 (inflation adjusted) a month and you continue for 175 months. Say you started on the upward slope of the market, at the peak, on the downward slope or at the minimum of 2002. How much do you end up with in each case?

Clearly starting earlier is better. So hurray for me, I finally understand the common wisdom!

3 Likes

Hi @Alex i was just checking your simulations. I have some cash on the sides as well and… although “you should never try to time the market” It’s interesting to see what it really means in terms of money.

So: Here’s what I found out, I noticed that in your simulation you always start with the same cash (0) but. In reality, the starting cash should be

starting_cash = cash + (nMonthsWaiting * Savings_per_month) nMonthsWaiting // number of Months Waiting to enter the market

In your example:

starting_cash = 10,000 + ( 0 * 100) // for the first "not so bad" graph

Thus, the red line (“Good timing”) starting cash should be:

starting_cash = 10,000 + (42 * 100)
starting_cash  = 14,200
nMonthsWaiting = 42 // That's from 1999 to mid 2002

I ran 2 simulations using your link (thanks for that :wink: )

Simulation 1: Starting at the top of the .COM bubble
Starting date: Jan 2000
End sumulation: at the top of the subprime crisis Jul 2007

staring_cash = 10,000 + (0 * 100) 
starting_cash = 10,000 

Saving 100 p/m you end up with 27,334.07 in Jul 2007

Simulation 2: Starting at the bottom of the burst .COM
You realize you’re in the top of the bubble (Jan 2000) and decide not to invest but to hold your cas on the side + continue saving 100 p/m in cash as well, so in Jul 2002 at the bottom of the burst you invest your starting_cash

starting_cash = 10,000 + (30 * 100) // 30 months from Jan 2000 to Jul 2002

starting_cash = 13,000

At the end of Jul 2007 you end up with 31,556.53 that’s 15.4% more than investing at the top of the bubble

Am I missing something in your simulations??

BTW, did you generated those graphs directly on the website?

cheers

I think this is very important point that I’ve learned from my financial gurus. I also was waiting for few months for a next big crash because I was afraid of investing at historical peaks. One of my colleagues who’s a finance professor and was institutional investor told me that he has seen in his life so many bad timings done by really smart and competent investors that it just doesn’t make sense. Just keep it simple instead - stay fully invested and invest as often as possible. If professional institutional investors with all their knowledge and resources can’t time the market, then how we could do that?

PS. The solution to fear is, as @hedgehog says, safer asset allocation or more diversification. Ultimate solution is to learn Buddhist zen and stay relaxed.

1 Like

Hola @Mr.HdLR,

I see what you mean, but I think that’s a different simulation altogether. In both simulations you’ve decided to invest in Jan 2000, the only difference is that in the 1st it’s in the market, and in the second it’s in inflation-protected cash for the first 2 years.

I was just using the historical numbers as if they were the future. “What happens if I start investing now and the market crashes like it did in 2000?” etc.

The website doesn’t produce graphs. I just exported the data, imported it into excel, massaged it a bit and graphed it there. At some point I also produced some graphs where I used the same length of time for all simulations, regardless of their start point. I didn’t save them, though. :frowning:

You may want to have a look at this article by Roberto Plaja called Donald Duck vs. Gladstone Gander (it’s a google translate from Italian but you get most of the points).

Even between the world most lucky and the most unlucky investor, time smooth things out.

(Disclaimer: Roberto is an adviser in simplewealth, an investment management service I cofounded - eating my own dog food here!)

1 Like

What metrics do you follow? The one I know about is the CAPE ratio, which you can find here: Online Data - Robert Shiller. I read that when it is below 15 the stocks are cheap and above 25 they are too expensive. We are now at 33.6, so no bargains at the moment, right?

The market is very high and it’s hard to find things with a discounted prices. The only category so far that looks like a discounted opportunity are the US REITs which are trading at the bottom of a range. I therefore added some VNQ to my portfolio.

just found that in the mmm forums:

5 Likes

Read an interesting interview today about financial analysts (only in german)

I found particularly interesting to read a convincing point against market timing. I sometimes read an opinion from a market analyst and find it logic, but one should not feel like ready to time the market after some news/blog/…

What about stop loss? No one use it?