I have collected my “tools” for figuring out the weighting of geographically-split multi-funds portfolio and the optimal arrangement of geographic segments between taxable brokerage accounts (ETFs) and funds in 3a custody account in one Excel sheet. I would like to share it with you, not just to show my results, but to give you an opportunity to adapt it for your purposes.
I am happy to present it:
The first sheet “MSCI data” summarizes various indices defined by MSCI and some data for them. The data are taken from the most recent factsheets for MSCI indices. These are input data for further calculations. While I might update it in 6 months or so, it should be good enough until then.
The second sheet is “splits”. It summarizes (almost) all splits of the global all-world stocks market that I was able to come up with and weighting of the corresponding segments. Feel free to use it as a starting point to construct your portfolios. You can also remove some (e.g. Canada, Switzerland, Emerging Markets), the “renormalized” weights are getting recalculated.
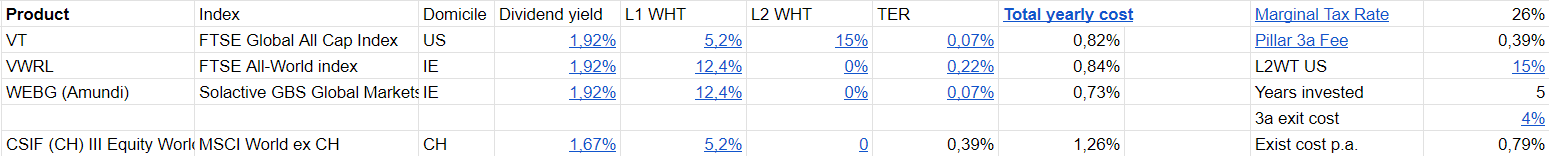
The third sheet is “vehicles”. It calculates “total investment cost” (let’s call it TIC) for various investment vehicles bases on the gross dividend yield (of an index), TER (of the investment vehicle), L1 (depends on investment’s domicile) and L2 (depends on fund’s domicile) withholding taxes and the personal marginal income tax rate. The numbers are either known or my best guesses. You should put your marginal income tax rate and might want to also modify other things, like put TER for your specific ETFs and so on.
Warning: All these data are very much guestimates. TER is not necessary how much a fund is losing between collecting dividends and distributing them. You can try using tracking differences, for example. Anyway, taking all this into account, my guesstimate is that the precision of resulting TICs is 0.1% at best, or rather around 0.2%. It means that a costs difference of less than 0.1-0.2% is too small to be meaningful.
Anyway, there are some trends to be observed and they correspond to my earlier conclusions:
-
For all geographic segments, TIC decreases when the investment goes into a tax-sheltered 3a custody account, but by a significantly different amounts.
-
The advantage is the least for the USA market. Respectively, it should be the lowest priority to go into 3a.
-
The advantage is at the higher end for MSCI Pacific ex Japan (high dividend) and for Switzerland if invested via True Wealth 3a (no provider’s fee).
-
The advantage of investing into Canada via a 3a fund at Finpension is mostly the lack of hassle of finding an ETF for it 
-
The rest is kind of in-between when it comes to the 3a advantage.
The forth sheet is where you can compare costs of whole portfolios.
My idea was to calculate the costs of alternative portfolios with the same total value for each geographic segments, but invested through different vehicles. Often you cannot compare just individual segments, in particular when there are limitations on portfolio composition (VIAC, True Wealth).
Here I would also consider a costs difference of less than 0.1-0.2% too small to be meaningful.
There are some simple examples, and in all of them the result was “inconclusive”
Have fun.
元博士