Calculate price delta and its ratio (\frac{p_{t1} - p_{t0}}{p_{t0}}). It’ll look nice on file.
Calculate price delta at old quantities: ( p_{t1} * q_{t0} - p_{t0} * q_{t0} = \Delta p * q_{0}). Remember this.
Sum up all quantity deltas. Sum up all price deltas.
Substract price delta from actual performance (p_{t1} * q_{t1} - p_{t0} * q_{t0}) - (p_{t1} * q_{t0} - p_{t0} * q_{t0}). Remember this as outperformance.
You’ll see that you can further decompose it into the delta from quantity differences (vs never-rebalanced buy and hold) and price differences (from changed quantities vs t_0).
As to period - I’ve been contributing to one portfolio weekly from early 2022 on which if you remember was anything but a bull market (-25% from peak), with similarly good results (as discussed above). The reason those results don’t factor in here is because I’m more curious what happens vs portfolios otherwise “at rest”, which I can calculate rather easily (see above).
For the nine months from September '22 to July '23 (“full range”), outperformance as calculated like this is on the order of 3.92\% to 4.02\% - do note that in this case, the CHF sum is identical to the quantity delta shown above, which is nice. Probably a bit less after stripping out dividends, but not that much.
Edit: On another note. With portfolios that do not have any significant contributions, TWR is equal to the geometric growth rate, which I’m showing above.
To be honest, I am not sure if you didn’t get lost in the woods; so lets have a look at the overall forrest.
What we care about is the different in return (TWR) of the re-balanced Portfolio vs. the not re-balanced Portfolio. To make sure that the non-rebalanced Portfolio drift off too much, I would to be price compare against the average returns of both a Portfolio that started with the target Asset Allocation - and a Portfolio that ended with the target asset allocation.
This now means that we need three TWR returns, one for the re-balanced Portfolio, one for the set once and never re-balanced Portfolio and one for the Portfolio that after 9 months of drift reaches the target Asset Allocation now.
Alternatively, you can as well take the TWR of the re-balanced Portfolio and the TWR of the individual sub-components that constitute the target AA.
Do you have these figures at hand? Where did you take those from?
To be precise, why I bug you here - I fear that you compare total return with Funds‘ NAV return and by doing so incur a Delta as Viac in Q1 granted the Portfolio WHT Tax Credits on Swiss Equities and non Equity Funds…
If you are correct and the premium is 0.5%, on an annual 3 Pillar allowance of 7000 this is 35 CHF/yr. Good theory but is it micro optimisation and wouldn’t you get most of the benefit by letting VIAC rebalancing run normally ?
Let’s keep it civil here. If someone got lost in the woods that’s you, with your insistence on TWR.
If inflows are immaterial relative to assets deployed (which they are, when you’re adding 1 CHF to a >15k portfolio) TWR is equal to the geometric growth rate, which… as said… I’ve shown above. See the definition of TWR on Wikipedia if you don’t believe my word on it. You’re quibbling over 0.01% right now.
Can’t you simply „force“ VIAC to rebalance by adjusting your asset allocation on a weekly basis, thereby eliminating hard-to-isolate additional inflows? (I.e., adjust allocation after one rebalancing date and adjust to original or intended allocation again before the next rebalancing date).
Open up a second portfolio with the same amount of invested money - and easily compare the two on a real-life performance basis?
Personally, I do force a re-balancing a monthly re-balancing on Viac. This by simply re-selecting the same strategy again. The interesting thing is that compared to Finpension, where I don‘t re-balance at all - I hardly don‘t see any performance difference. Hence my strong push to have avery careful look at the perceived re-balancing premium.
Do you have performance figures for both a re-balanced and a non-rebalanced Portfolio? If you don‘t like TWR, just any performance figures that could be compared? Or against what performance figures do you benchmark your rebalanced Portfolio?
Do you have performance figures for both a re-balanced and a non-rebalanced Portfolio? If you don‘t like TWR, just any performance figures that could be compared? Or against what performance figures do you benchmark your rebalanced Portfolio?
I’ve explained the math about benchmarking I do here:
If you are correct and the premium is 0.5%, on an annual 3 Pillar allowance of 7000 this is 35 CHF/yr. Good theory but is it micro optimisation and wouldn’t you get most of the benefit by letting VIAC rebalancing run normally ?
It’s on the order of 4%, which on a portfolio with several years of calculations is higher than my day rate. Again, pretty solid for (now) three standing orders of CHF 1,00.
That’s huge. Which low-correlated assets are driving it - what are the assets and weight you have in the 2 portfolios (or 3)? You have exactly the same weight in each portfolio and the only difference is you are rebalancing weekly in one and monthly in the other (?)
That’s the rub, it doesn’t seem to matter if I do this on a diversified portfolio with real estate and gold mixed in, or on a ‘classic Viac’ Global 100 portfolio. Ballpark returns are the same.
Portfolio 1 (stocks + re): 62% stocks, 30% real estate, 5% gold, 2% listed PE
Portfolio 2 (stocks ch), 90% stocks 9% gold
Portfolio 3 (shannon’s demon): Viac Global 100%
I’ve pulled the portfolio reports quarterly and extracted (copy+pasted, heh) the funds quantities into an Excel spreadsheet. What I’ve called outperformance above is indeed from the amount of shares increasing.
Hard to argue with this type of “number go up” , and honestly, too good not to share.
At what point do I include a disclaimer that this is not financial advice?
This is where the Problem comes from, and why I insisted on TWR. Your calculation omits distributions from the funds. And actually not only „ordinary“ distributions but as well WHT Benefits you receive on Accumulating funds.
Have a look at the TWR of each component and the TWR of the total Portfolio; and you see the real premium. If you use truly uncorrelated assets (Gold, Commodities, Bonds, Cash and Shares; re-balancing will probably give you 0.1 to max 0.3% p.a.
If the inflows C_1 to C_n are sufficiently small when compared to M_0 … M_{n-1}, this can be simplified to
1 + R = \frac{M_1}{M_0}\times\frac{M_2}{M_1}\times\frac{M_3}{M_2}\times \cdots \times\frac{M_{n-1} }{M_{n-2}}\times\frac{M_{n}}{M_{n-1}} = \frac{M_n}{M_0} , and obviously R = \frac{M_n}{M_0} -1 at portfolio level.
It is trivial to see that whether funds pay out [tax-reduced / tax-free] dividends or whether they accumulate profits within the funds is immaterial, as neither constitutes an external flow per the equation from Wikipedia.
And that ballpark you mention of 0.1\% to 0.3\% is not even close to being in line with the academic literature on this subject, which I linked above.
The Problem is not that you don‘t use TWR, the Problem is that you don‘t use any meaningful performance metric at all. You could use MWR as well, and you would get comparable results. You would still get the same results if you strictly applied the formula you posted a few answers above. However, I understand from your prior post that you simply have a look at the number of fund shares that constitute the overall Portfolio, adjust for KNOWN distributions and take increased share/fund quantities (times NAV I guess) as a proxy for overperformance percentages. That calculation is wrong.
Just to give you a rationale why you need to use TWR, MWR or whatever performance metric. The assumption you take in the below statement is wrong (at least for VIAC 3A Funds):
VIAC invests into Swiss Index Funds. Whether accumulating or not, all Swiss Index Funds pay 35% withholding tax on distributed OR accumulated dividends (restricted pillar 2/3 funds beeing the exception). VIAC then claims this back from the Swiss Tax Authorities and once they get the money back, they credit it into your account. Meaning that you at this point in time receive a „dividend“ where the corresponding reduction in NAV already took place 9-18 months before. You could as well compare this with a distribution that had an ex-date very far in the past and that was neither listed in ICTAX nor a sub-funds Factsheet. To make things worse, I think that VIAC grants these credits in Q1 which neatly falls into your measurement window (at least they did so in the past, the last time I checked).
In conclusion, it is very tricky to calculate accurate performance figures and this particularely if you simply have a look at the Portfolio‘s positions / share numbers and how they evolve.
Proposal: 15k is a fairly average amount for VIAC and it won‘t expose your identity. Why don‘t you post your actual calculation and the underlying data used? This will allow to show you, on a calculation step by calculation step basis, where the Problem comes from and how the calculation needs to be fixed?
Can you show me a screenshot of those transactions? Because in all the portfolio history I just looked through going back to 2018, I’ve not seen a single such credit. Normally, WHT tends to apply only to entities liable to WHT, which Viac wouldn’t be (also per the FAQ, 3a, “es fallen keine Vermögens-, Einkommens- oder Verrechnungssteuern während der Laufzeit an”)
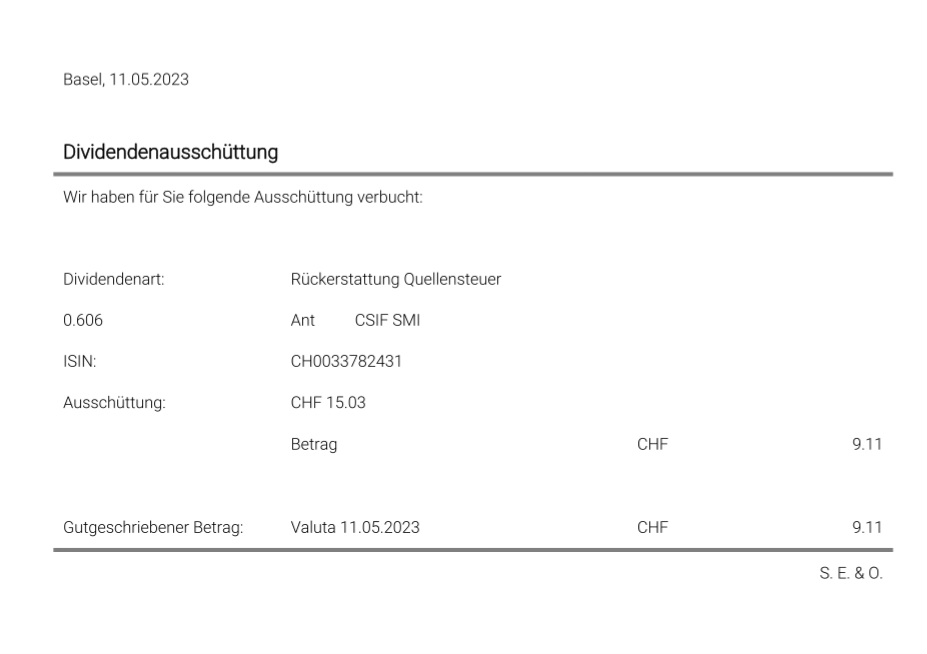
It states there that it is a reimbursement of withholding tax.
Yes, exactly that’s why you get it reimbursed. However the change in NAV from the distribution/accumulation was some months ago, the reimbursement of WHT takes a lot of time depending on the country and also on the efforts of the funds to reclaim them
Ok, found them. In 2023 these credits arrive on the same day the dividends arrive, so on the same day the dividend payments get debited from fund prices.
That seems strange. You never get WHT back immediately, you have to claim it and then wait, otherwise VIAC would need to pay you back WHT in advance, but this seems unlikely to me as they would bear the risk of not getting back the full WHT (tax treaties changing, some countries refusing to pay them, etc.) and also interest on the amount paid in advance that gets lost.
It’s anyway special that they pay out reclaimed WHT, the normal procedure is to keep it in the fund and adjust the NAV accordingly.
Lets not get distracted with Details - lets focus on the basics. What precise calculation do you do to come down with your „overperformance“. Not focusing on the formula but the data.
Reason why I ask. Its a strange approach but technically, you could have a look at the fund holdings on date A, have a look at all distributions, interests and fees since and based on this calculate both how the Portfolio would have had evolved both with and without re-balancing.
But to be honest, we already know the answer from various empirical examples and the Portfolio-visualizer backtest someone else posted above. We only do this to see where the calculation mistake comes from and what a real re-balancing premium was.
Finpension takes this risk. Actually, for Finpension the risk is smaller as they only use funds domiciled in Switzerland. Viac as well uses IE based ETF and at least on them, I am fairly sure the WHT Credit will only come later on.
Mit dem Lesen und der Teilnahme an diesem Forum bestätigst du, dass du die Forum-Richtlinien gelesen hast und damit einverstanden bist sowie den Haftungsausschluss auf http://www.mustachianpost.com/de/ akzeptierst.