This certainly rings true to me but I haven’t done the homework for VT or similar funds/indexes over the long run. Perhaps you’ll find data at Kenneth French’s website: Kenneth R. French - Home Page (dartmouth.edu)
Going back to 2008 this is what the VT’s dividends looked like, according to Divvidiary:
(You can probably ignore 2008 since VT’s inception was only in the middle of 2008))
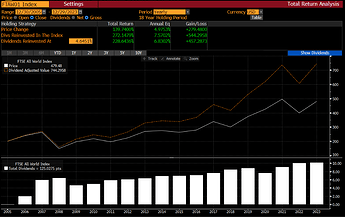
The FTSE All-World index – used by VT before December 18, 2011 – only goes back one or two more years, I’m afraid. But the (dividend) returns look similar:
(Again, probably ignore 2006 as the index started not at the beginning of the year)
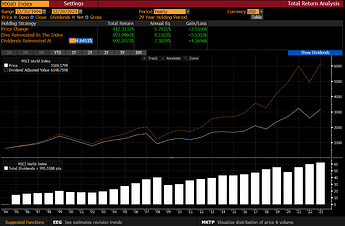
The MSCI World – not sure how much overlap there is with the FTSE All-World – goes back to 1995 and it looks like this:
Mostly up and to the right, but some sideways years, e.g. after 1999. The first time the dividend exceeded the 1999 one was in 2004.
After the great financial crisis in 2008/2009 it took until 2014 until the dividend exceeded the 2008 one.
After 2019 the dividends dropped only in 2020 and recovered (barely) in 2021.
Goofy’s plug:
Of course you could optimize this further if you picked a custom portfolio of (mostly) companies with a history of paying and growing dividends (like mine aka the Goofy Index™) instead of “the market”. Its dividend track record:
Admittedly, it has one* hickup as well, but overall seems smoother? The biggest drawdown (in dividends) was from 2007 to 2008: -15%. It took until 2011 for the dividend returns to exceed the 2008 ones.
Also note: no dividend drawdowns after the tech bubble blew up and after COVID-19.
* I don’t consider the drop from 2012 to 2013 as a drawdown – it looks to me more like 2012 was an outlier peak.


