VTI is a much bigger fund than VT in terms of assets under management, and likewise VEA/VWO/VSS are much bigger than VXUS.
1 Like
Just checked Vanguard’s site
as of end of May 2017 the fund sizes were as follows:
VEA - $86.4 billion
VWO - $75.8 billion
VSS - $4.5 billion
VXUS - $280.3 billion
how come it is bigger?
or I am looking at wrong data?
Yes, you’re probably looking at a wrong number. This is straight from Vanguard: “Net assets for VXUS: $8.4 billion as of 05/31/2017”
AUM for all funds mentioned:
VT: $8.4B
VTI: $79.2B
VEA: $53.8B
VWO: $55B
VSS: $3.6B
VXUS: $8.4B
VTI+VEA+VWO+VSS > VTI+VXUS > VT
3 Likes
yes, it looks like
I was referring to this site
https://personal.vanguard.com/us/funds/snapshot?FundId=3369&FundIntExt=INT
Which says on VXUS
Characteristics as of 05/31/2017
Fund total net assets $280.3 billion
While if I got your link right, it then should be divided in several sub funds, where VXUS is a part of this 280bln… Good to know!
Thanks!
Looking at fund’s report, it seems to me that “Net assets for <ticker>” (such as $8.4B for VXUS) refers to assets attributable specifically to ETF shares, whereas “Fund total net assets” counts assets for all types of shares in corresponding Vanguard’s mutual fund. So the latter could be used as a proxy for fund’s efficiency and tracking error, and the former for its liquidity
I just stumbled upon this thread and thought I might add my 5 cents.
It’s important to note that it isn’t a fixed 50%-50% split. It just so happens, that currently USA represents roughly 52% of the FTSE Global All Cap index, which is the index that VT follows. VT practically includes VTI plus a few thousands more companies. If the USA stock market grows at a faster rate than the rest of the World, the share of USA within VT will grow (and vice versa). FTSE Global is a market cap weighted index, so price changes do not trigger the need for rebalancing.
Regarding the question: US vs International, I think it’s worth it to retrack their perfomance over a long period of time. Here is a chart from the MSCI website comparing the total return of USA vs World ex USA (note that MSCI World includes only developed countries).
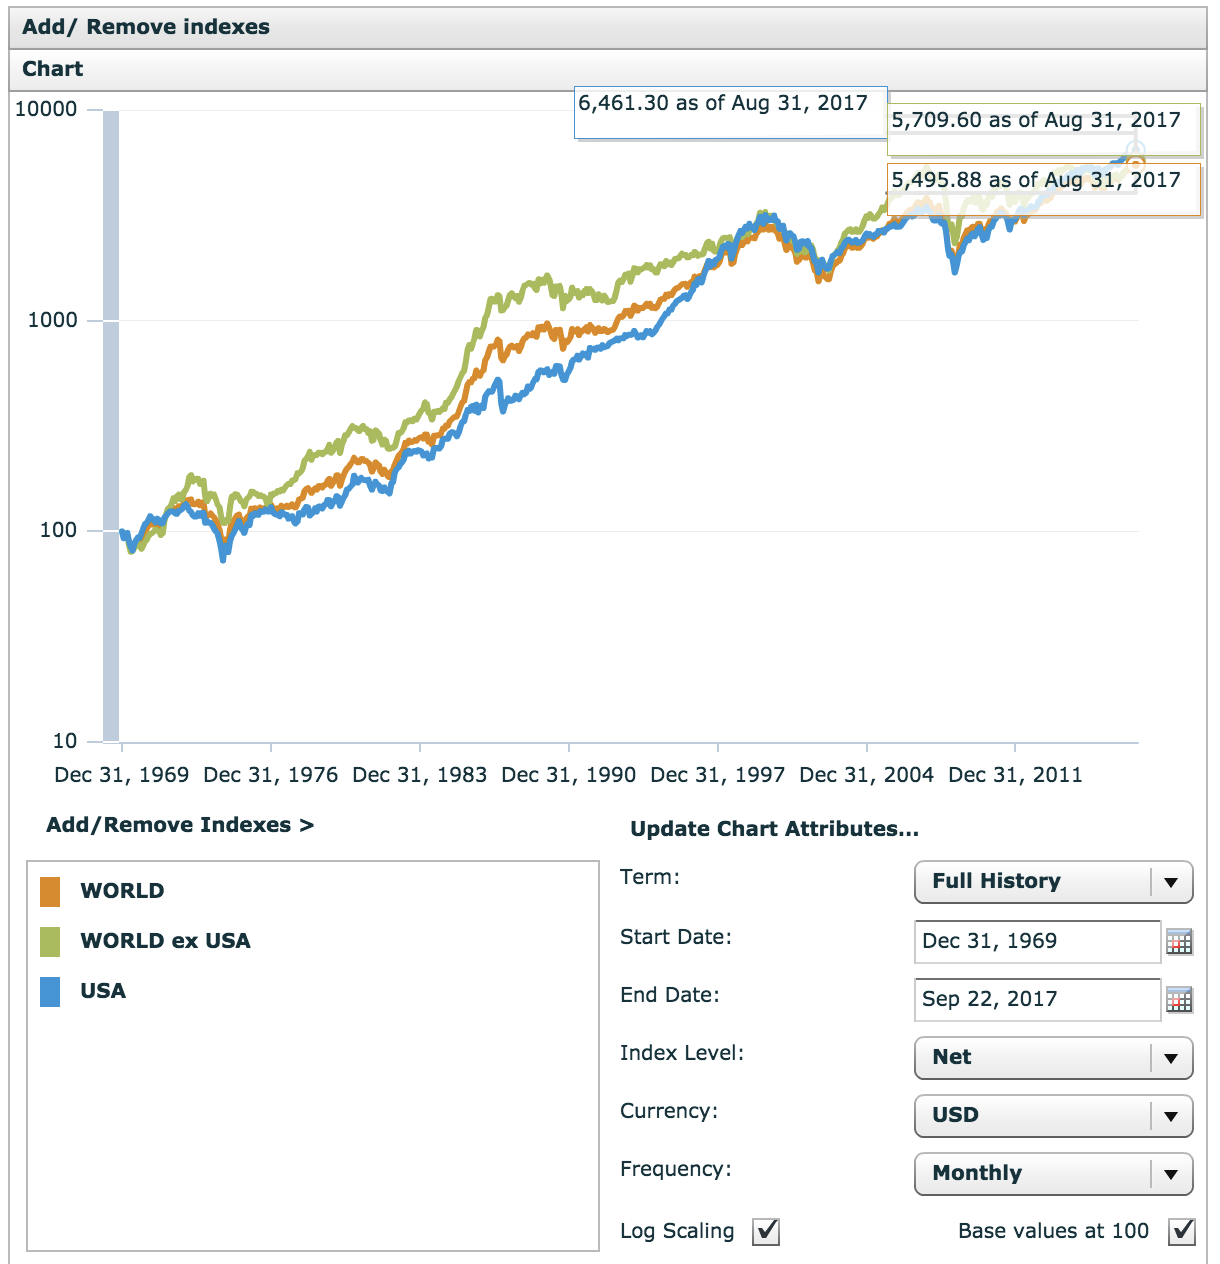
As you can see, the World ex USA has had a pretty good run in the 80s, but then the USA caught up in the 90s. Since 6 years the USA is constantly outperforming the World. In the long run, both indexes have performed similarly. But it takes a long time, decades, for them to realign. So if you opt for the wrong one today, you may wait another 20 years until it catches up.
The World Index, which includes USA, takes the middle road. I think it can reduce volatility in a very long period. That’s why I think VT is the safer bet than VTI.
5 Likes
@hedgehog I’m curious to know why do you included VSS (developed and emerging non-U.S. small-cap) in your selection - is developed and emerging non-U.S. small-cap not already covered under VEA + VWO?
In terms of caps and markets, VT(100%)= VTI (55%)+VXUS (45%) = VTI(55%)+VEA(36%)+VWO(9%), correct? (but of course the fund sizes are differ)
VEA + VWO includes the same Small Caps as VSS. This said, I personally agree with the idea of adding a small tilt to international small caps and VSS is the perfect vehicle to do it.
Some reasearch would be required to confirm this, but as of now I believe that only the VWO out of all these funds includes China A-shares*. (from Vanguards page for VWO: “Goal is to closely track the return of the FTSE Emerging Markets All Cap China A Inclusion Index.”).
This would put its market cap at closer to 10-11% of global market cap (and will grow as more China A-shares make their way into the index).
*China A-shares are large cap shares traded on China domestic markets in local currency. They are gradually making their way to various (but not all) Emerging Market ETFs via China A-shares inclusion indexes.
1 Like
@glina I have done the research (I think)
VXUS (Vanguard Total International Stock ETF)
FTSE Global All Cap ex US Index
| 20.50% | Emerging Markets | |
|---|---|---|
| 42.50% | Europe | |
| 29.50% | Pacific | |
| 0.40% | Middle East | |
| 6.70% | North America | |
| 0.40% | Other |
VWO (Vanguard FTSE Emerging Markets ETF)
FTSE Emerging Markets All Cap China A Inclusion Index
| 98.00% | Emerging Markets | |
|---|---|---|
| 0.40% | Europe | |
| 1.60% | Other |
VEA (Vanguard FTSE Developed Markets ETF)
FTSE Developed All Cap ex US Index
| 0.30% | Emerging Markets | |
|---|---|---|
| 53.50% | Europe | |
| 37.20% | Pacific | |
| 0.50% | Middle East | |
| 8.40% | North America | |
| 0.10% | Other |
So according to my calculations VXUS (45%) = VEA (36%) + VWO (9%) .
You mentioned “I personally agree with the idea of adding a small tilt to international small caps and VSS is the perfect vehicle to do it”. Can you briefly explain why one might want to add a tilt to Int small cap?
This is exactly why I wrote that only the VWO follows the China A-share inclusion index.
VXUS and VT don’t include China A-Shares which means their EM holdings are proportionally smaller.
In one chart:
https://www.msci.com/documents/10199/a67b0d43-0289-4bce-8499-0c102eaa8399
1 Like
Yes, ok I know the VXUS does not include China A shares - sorry I don’t understand how this effects the calculation.
VXUS has 20% emerging markets; so 45% of 20%EM (i.e. VXUS (45%)) = 9% EM
VEA has say 0 EM; and VWO has say 100% EM, so 9% of VWO = 9% EM
So VXUS (45%) = VWO (9%) + VEA (36%)
Thanks so much for the chart ![]()
If I understand correctly small cap have produced an excellent yield - but they are high risk (higher risk than mid cap, and an even higher risk than large cap). If I am correct maybe I would just consider putting some “play money” into a small cap (or med cap) ETF.
1 Like
Simple.
VXUS < VXUS + A-shares, which changes the balance of it all. I can’t be bothered to research this exactly as FTSE doesn’t publish their numbers as clearly as MSCI.
You can learn a bit about A-Shares form this MSCI page:
Also remember that MSCI EM is not the same as FTSE EM. The largest difference is South Korea, which is classified as EM by MSCI but is Developed according to FTSE.
As to small caps - this worked before. No guarantee for the future. I don’t think it’s a big risk long term. Worst that can happen is you spend a tiny bit more on fees (VSS is 0.13% TER as compared to weighted 0.06% of VTI+VEA+VXUS).
2 Likes
VT vs VGWL (latter one is Total World fund of Vanguard for Europeans)
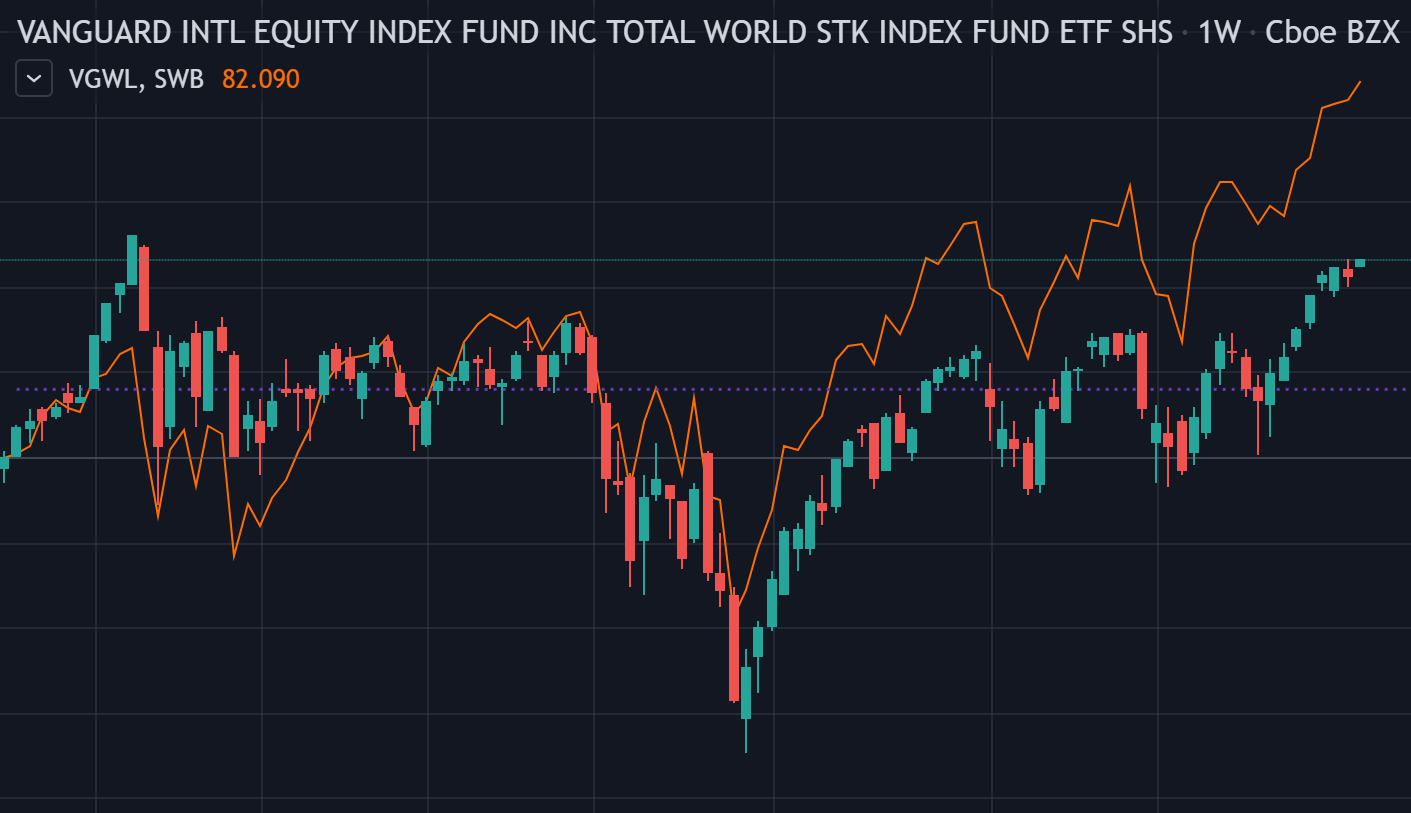
However I do not understand why those two funds perform so differently while they have pretty much the same allocation of countries (of course there could be also a difference with having small caps included or not but the difference feels too big).
Can anyone explain this significant difference?
(acutally the VGWL is closer to the S&P 500 than to a Total Word Index)
1 Like
Did you plot them with the same currency?
2 Likes
Exactly, that Bloomberg tool is probably not smart enough to convert currencies for you. Instead, you should compare with VWRD. Then you will get a perfect alignment.
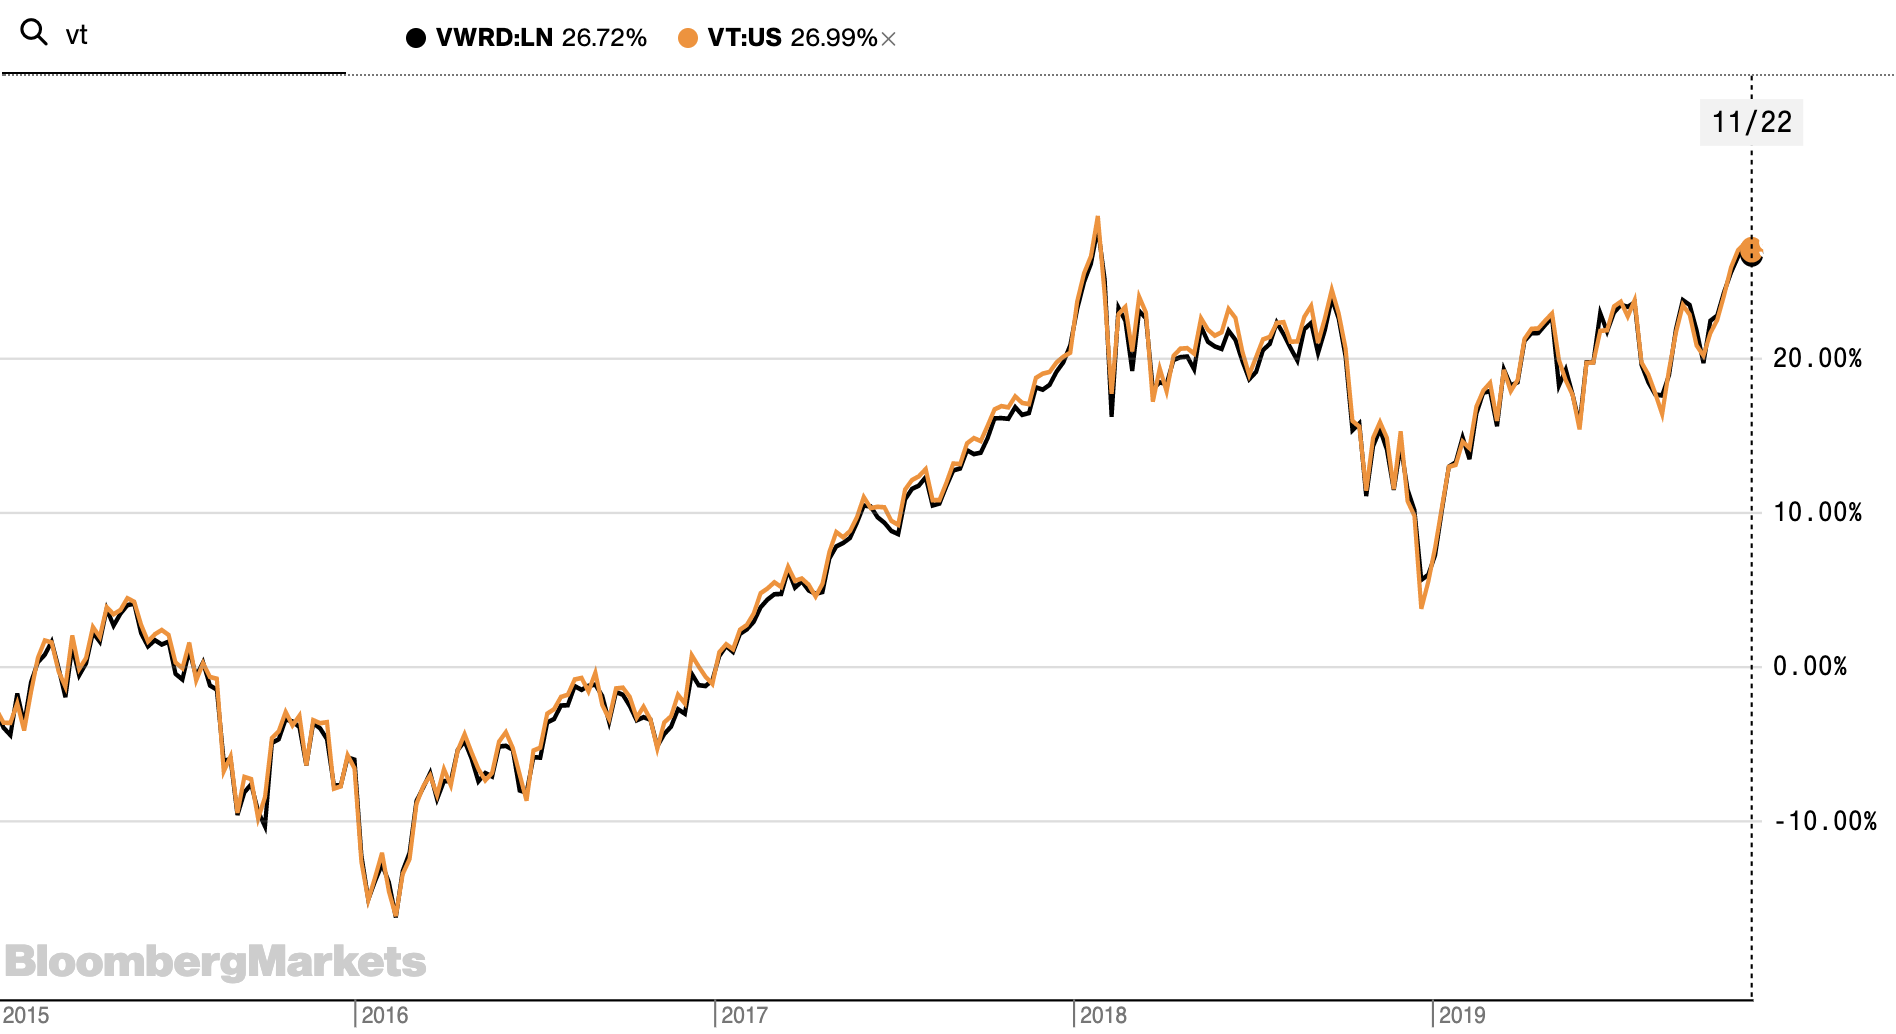
What remains, not visible on the chart, are dividends. VT has (relatively) higher, but it’s not easy to count, by how much, because they don’t get paid out on the same days.
3 Likes
Ohh of course… Ive compared with different currencies.
Other thing:
While VWRD is distributing and VT accumulating - shouldnt there now be still a difference?
VT is distributing, not accumulating.
Ok everything clear now - thanks a lot guys!
Hey hedgehog, do you mind sharing in which Vanguard ETF’s you are investing? I appreciate your knowledge you share in this forum.
Thanks man.
They have not really produced “excellent yield” for the past decade or so since they have underperformed (which might be a good case to take some now/soon/after some crash happens; because cyclicity).
Yes you are right that they come with higher risk and volatility.
Play money does not do much effect, people state anything less than 10/20% of your portfolio is not worth even adding to your investment logistics efforts.
But won’t hurt you as much to play around if it doesn’t work out, true. ![]()
Edit: short vid from the OG

1 Like