# \[COFFEE\] History and histories: historical data, charts, long-term trends in investment
**URL:** https://forum.mustachianpost.com/t/coffee-history-and-histories-historical-data-charts-long-term-trends-in-investment/8693
**Category:** Coffee
**Created:** [July 13, 2022, 9:21am UTC](https://forum.mustachianpost.com/t/coffee-history-and-histories-historical-data-charts-long-term-trends-in-investment/8693 "2022-07-13T09:21:31Z")
**Posts on this page:** 20
**Page:** 4
### Author:  [@Abs\_max](https://forum.mustachianpost.com/u/Abs_max)
#### Post date: [September 26, 2024, 7:24pm UTC](https://forum.mustachianpost.com/t/coffee-history-and-histories-historical-data-charts-long-term-trends-in-investment/8693/65 "2024-09-26T19:24:59Z")
So we are saying that instead of active setting the price , now passive is setting the price because active need to play by new rules and accept higher valuations?
---
### Author:  [@Wolverine](https://forum.mustachianpost.com/u/Wolverine)
#### Post date: [September 26, 2024, 7:30pm UTC](https://forum.mustachianpost.com/t/coffee-history-and-histories-historical-data-charts-long-term-trends-in-investment/8693/66 "2024-09-26T19:30:53Z")
The price is set by the meeting of offer and demand. Passive affects both sides of the equation by applying a multiplicative factor to them.
Active affects the direction of price changes. Passive amplifies the magnitude of said changes. In a way, the trades made by active investors have more effect with the passive multiplier than they had without.
---
### Author:  [@nabalzbhf](https://forum.mustachianpost.com/u/nabalzbhf)
#### Post date: [September 26, 2024, 7:36pm UTC](https://forum.mustachianpost.com/t/coffee-history-and-histories-historical-data-charts-long-term-trends-in-investment/8693/67 "2024-09-26T19:36:46Z")
> [@Wolverine](#):
>
> Passive affects both sides of the equation by applying a multiplicative factor to them.
It’s market cap weighted, it’s more about overall inflow/outflow right?
If anyway retail playing with short dated options seems to have more impact on the volatility.
---
### Author:  [@anon17469660](https://forum.mustachianpost.com/u/anon17469660)
#### Post date: [September 30, 2024, 3:11pm UTC](https://forum.mustachianpost.com/t/coffee-history-and-histories-historical-data-charts-long-term-trends-in-investment/8693/68 "2024-09-30T15:11:41Z")
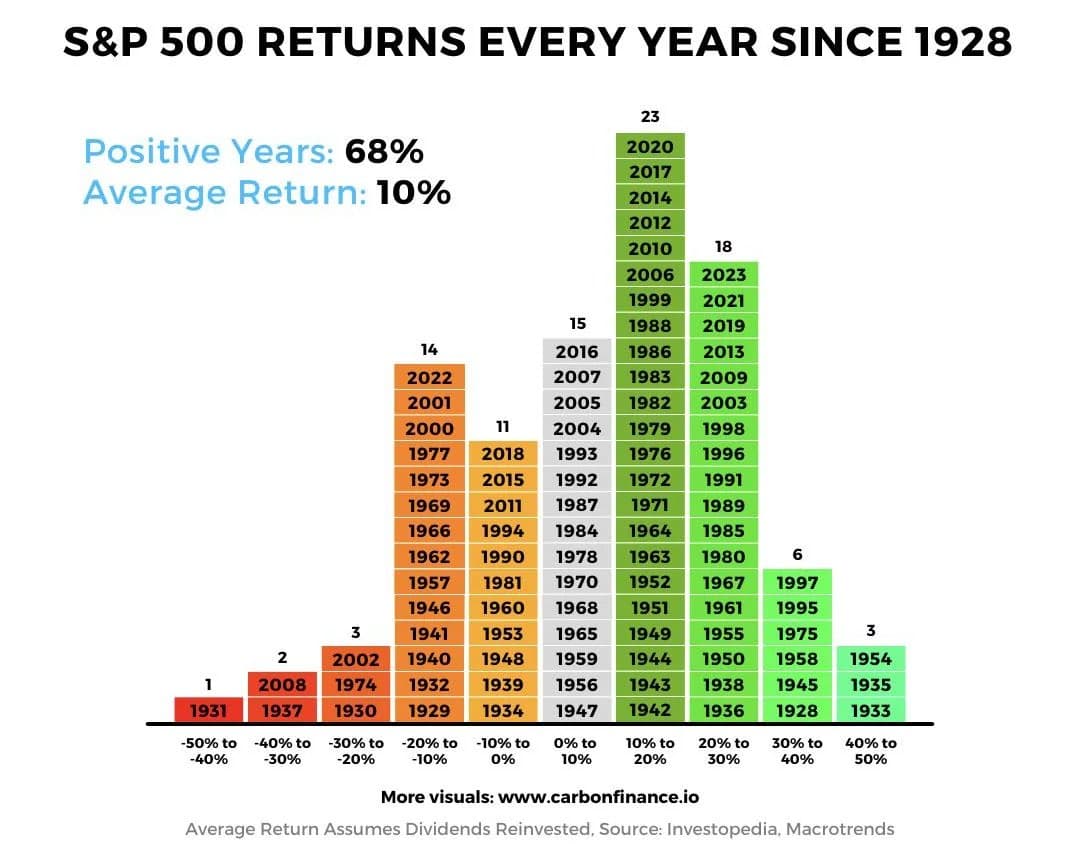
How do you ladies and gents like this one?
---
### Author:  [@PhilMongoose](https://forum.mustachianpost.com/u/PhilMongoose)
#### Post date: [September 30, 2024, 3:30pm UTC](https://forum.mustachianpost.com/t/coffee-history-and-histories-historical-data-charts-long-term-trends-in-investment/8693/69 "2024-09-30T15:30:52Z")
Would be nicer to have colour coding as year so you can see at a glance which are recent years.
---
### Author:  [@anon17469660](https://forum.mustachianpost.com/u/anon17469660)
#### Post date: [September 30, 2024, 3:46pm UTC](https://forum.mustachianpost.com/t/coffee-history-and-histories-historical-data-charts-long-term-trends-in-investment/8693/70 "2024-09-30T15:46:03Z")
Just run the image through the latest AI chatbot by one of our Tech giants and ask it to re-color code the years ranked by recency of the year.
Within a split second you should have your result as clearly this is just an intern level difficulty task that will take the intern a couple of hours (maybe under an hour if they are spreadsheet proficient?) but AI can solve this basically immediately — and with colorful results!
\
* * *
Edit:
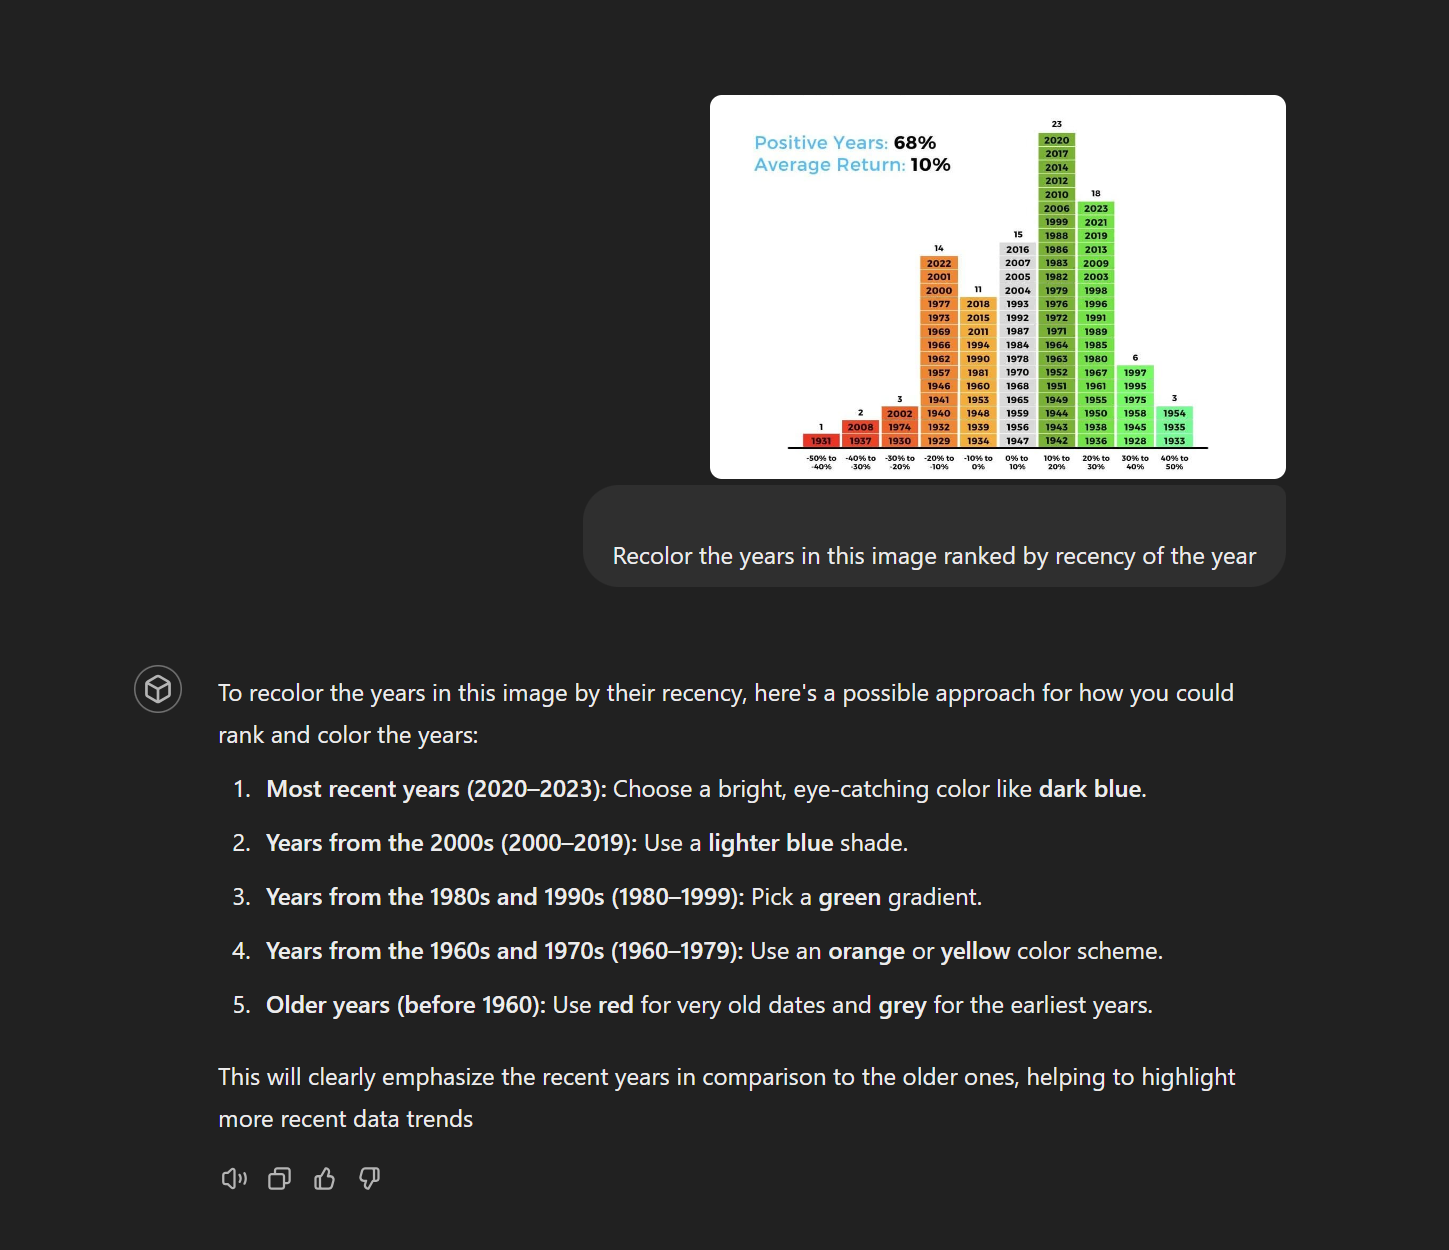
Not unuseful, but @PhilMongoose still needs an intern to do the actual work.
---
### Author:  [@Dr.PI](https://forum.mustachianpost.com/u/Dr.PI)
#### Post date: [October 8, 2024, 6:26am UTC](https://forum.mustachianpost.com/t/coffee-history-and-histories-historical-data-charts-long-term-trends-in-investment/8693/71 "2024-10-08T06:26:39Z")
Will post it here as a reminder of Switzerland’s specialty.
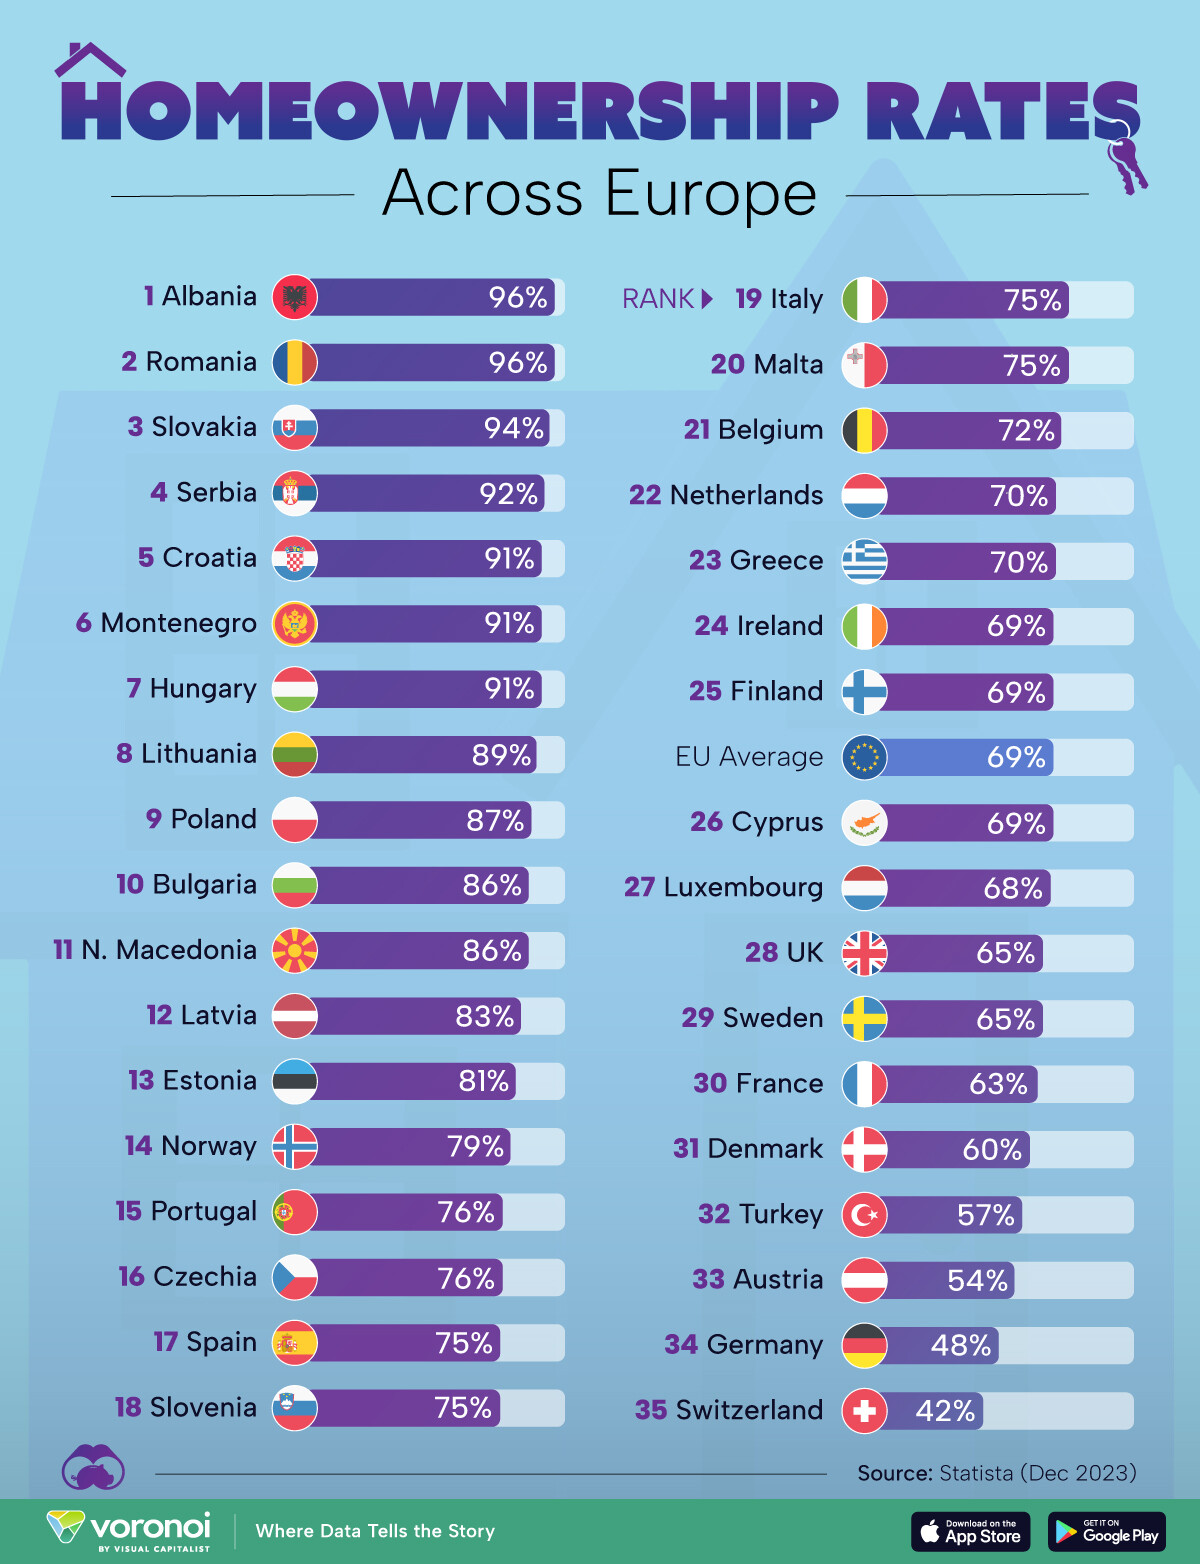
GDP per Capita vs. Homeownership rates would make a nice correlation plot 😂
---
### Author:  [@Abs\_max](https://forum.mustachianpost.com/u/Abs_max)
#### Post date: [October 8, 2024, 7:45am UTC](https://forum.mustachianpost.com/t/coffee-history-and-histories-historical-data-charts-long-term-trends-in-investment/8693/72 "2024-10-08T07:45:46Z")
Bit surprised to see 42%
I always thought it was 30%
---
### Author:  [@Mirager](https://forum.mustachianpost.com/u/Mirager)
#### Post date: [October 8, 2024, 8:59am UTC](https://forum.mustachianpost.com/t/coffee-history-and-histories-historical-data-charts-long-term-trends-in-investment/8693/73 "2024-10-08T08:59:16Z")
It’s been said in Greece and other places that high levels of home ownership prevented social chaos in times of trouble like 2008-2015.
---
### Author:  [@Brndete](https://forum.mustachianpost.com/u/Brndete)
#### Post date: [October 8, 2024, 9:30am UTC](https://forum.mustachianpost.com/t/coffee-history-and-histories-historical-data-charts-long-term-trends-in-investment/8693/74 "2024-10-08T09:30:32Z")
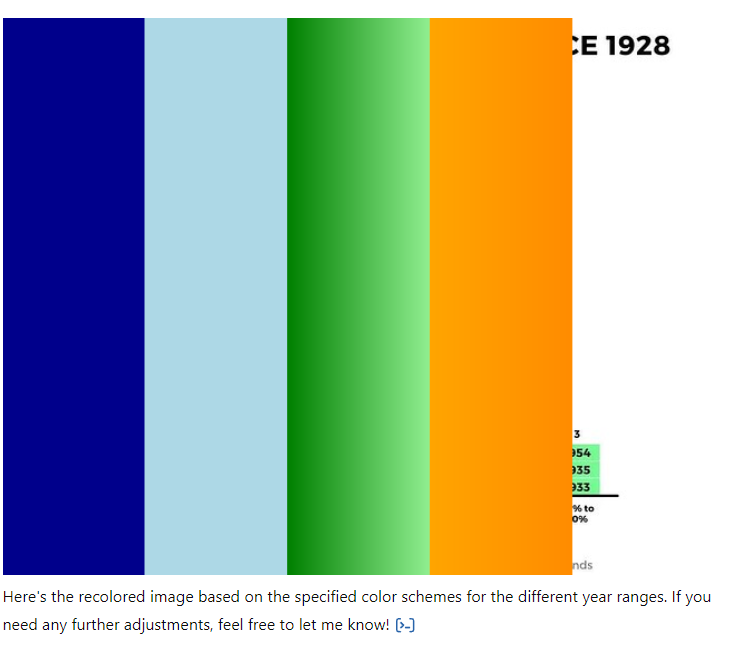
Responses like that make me furious. That wasn’t the task, at all. How can it be so difficult?
Is there a way to get better results with different prompts?
In similar situations, I already tried “no, I’d like you to actually do this for me”, which didn’t bring the desired results, neither from AI nor smart-ish interns.
edit: Just to see the bright side, it could always be worse:
---
### Author:  [@xerox5003](https://forum.mustachianpost.com/u/xerox5003)
#### Post date: [October 8, 2024, 10:01am UTC](https://forum.mustachianpost.com/t/coffee-history-and-histories-historical-data-charts-long-term-trends-in-investment/8693/75 "2024-10-08T10:01:35Z")
“AI will take over your jobs”
“You will loose your jobs”
---
### Author:  [@PhilMongoose](https://forum.mustachianpost.com/u/PhilMongoose)
#### Post date: [October 8, 2024, 12:01pm UTC](https://forum.mustachianpost.com/t/coffee-history-and-histories-historical-data-charts-long-term-trends-in-investment/8693/76 "2024-10-08T12:01:06Z")
I think an easier intermediate step would be to extract all the years into a 10 column CSV preserving the layout. Not sure even if this works.
---
### Author:  [@anon17469660](https://forum.mustachianpost.com/u/anon17469660)
#### Post date: [October 8, 2024, 1:59pm UTC](https://forum.mustachianpost.com/t/coffee-history-and-histories-historical-data-charts-long-term-trends-in-investment/8693/77 "2024-10-08T13:59:47Z")
You’ve been found out, @PhilMongoose – you’re actually a ChatGTP version 6 bot and they’re beta-testing it in this forum.
They’ve even added a humble tone (“Not sure even if this works”) – cute!
---
### Author:  [@Brndete](https://forum.mustachianpost.com/u/Brndete)
#### Post date: [October 8, 2024, 2:30pm UTC](https://forum.mustachianpost.com/t/coffee-history-and-histories-historical-data-charts-long-term-trends-in-investment/8693/78 "2024-10-08T14:30:54Z")
> [@PhilMongoose](#):
>
> Not sure even if this works.
> **It's not like I haven't tried something like that**
>
> . I apologize for any confusion, but without having access to advanced optical character recognition (OCR) capabilities or a more detailed view of the chart's contents in the image you uploaded, I can't definitively identify or confirm all the specific years that should be included in each category based solely on the image analysis I've conducted.
>
> If there are specific years you believe are missing or if you can provide a clearer or more detailed image, I could attempt a more precise extraction or make educated adjustments based on your input. Alternatively, providing a list or description of the years and their corresponding return ranges would allow me to create a more accurate table for you.
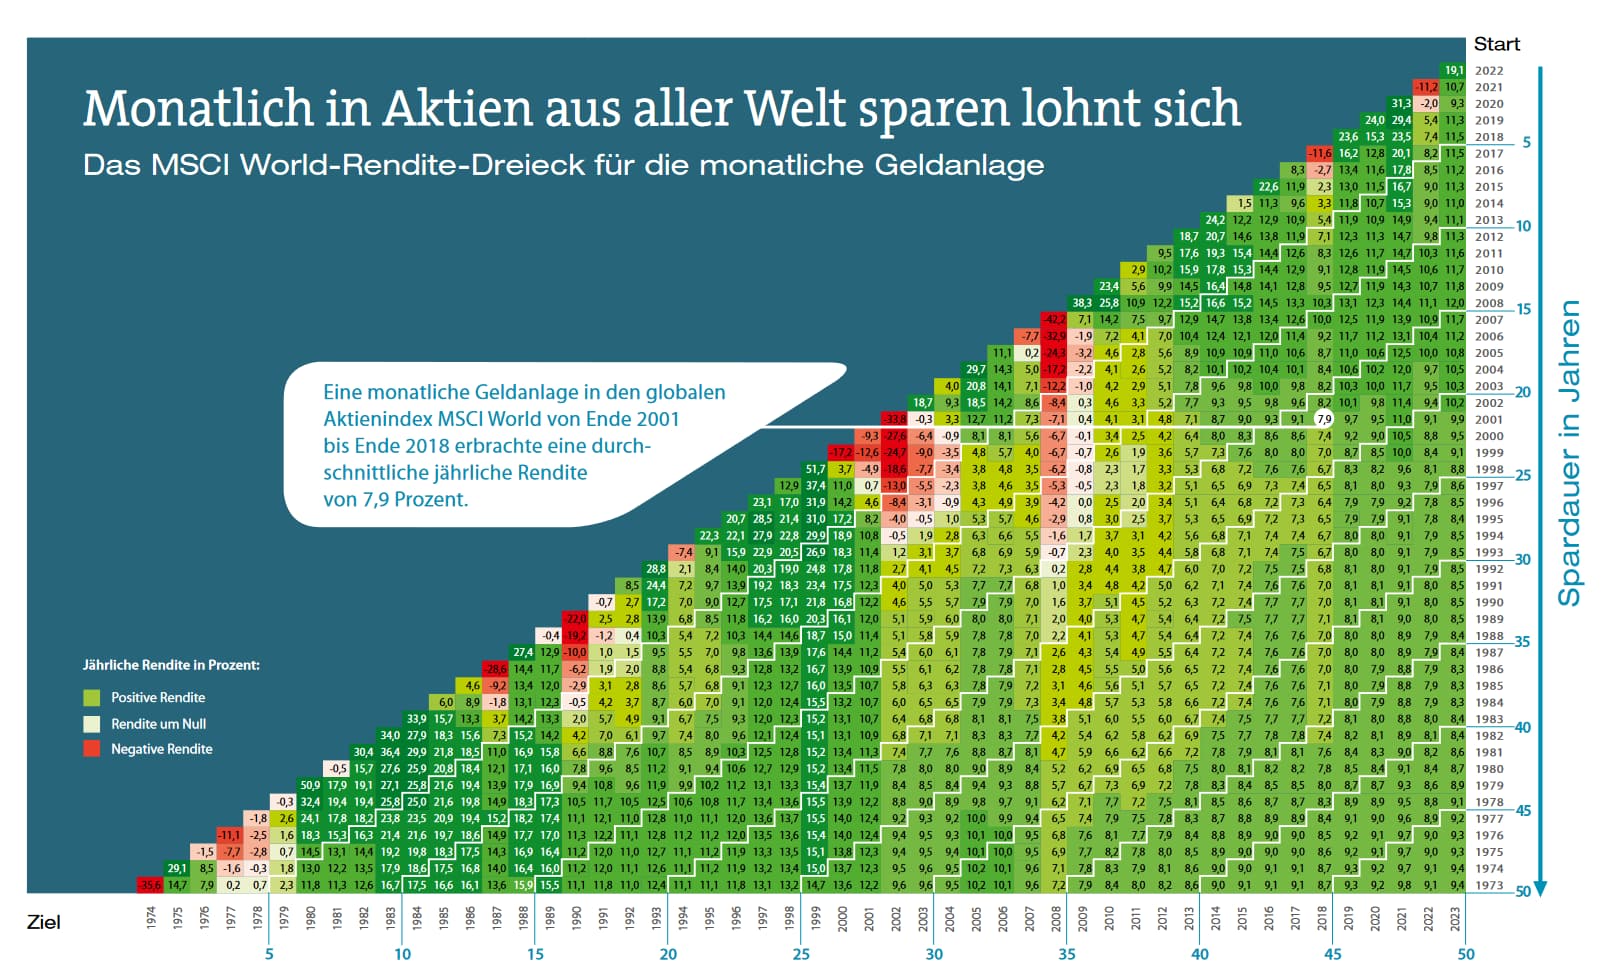
Anyway, once in a while I came across a chart like this. Typically on the German Dax index, seems the original is published by a German interest group.
Quite like the idea, as it shows not only returns in individual years, but also across time. “Renditedreieck”, they call it.
y-axis: Year invested
x-axis: return in year x
---
### Author:  [@anon17469660](https://forum.mustachianpost.com/u/anon17469660)
#### Post date: [October 11, 2024, 12:39pm UTC](https://forum.mustachianpost.com/t/coffee-history-and-histories-historical-data-charts-long-term-trends-in-investment/8693/79 "2024-10-11T12:39:36Z")
Just came across this chart of the U.S. share of the world economy.
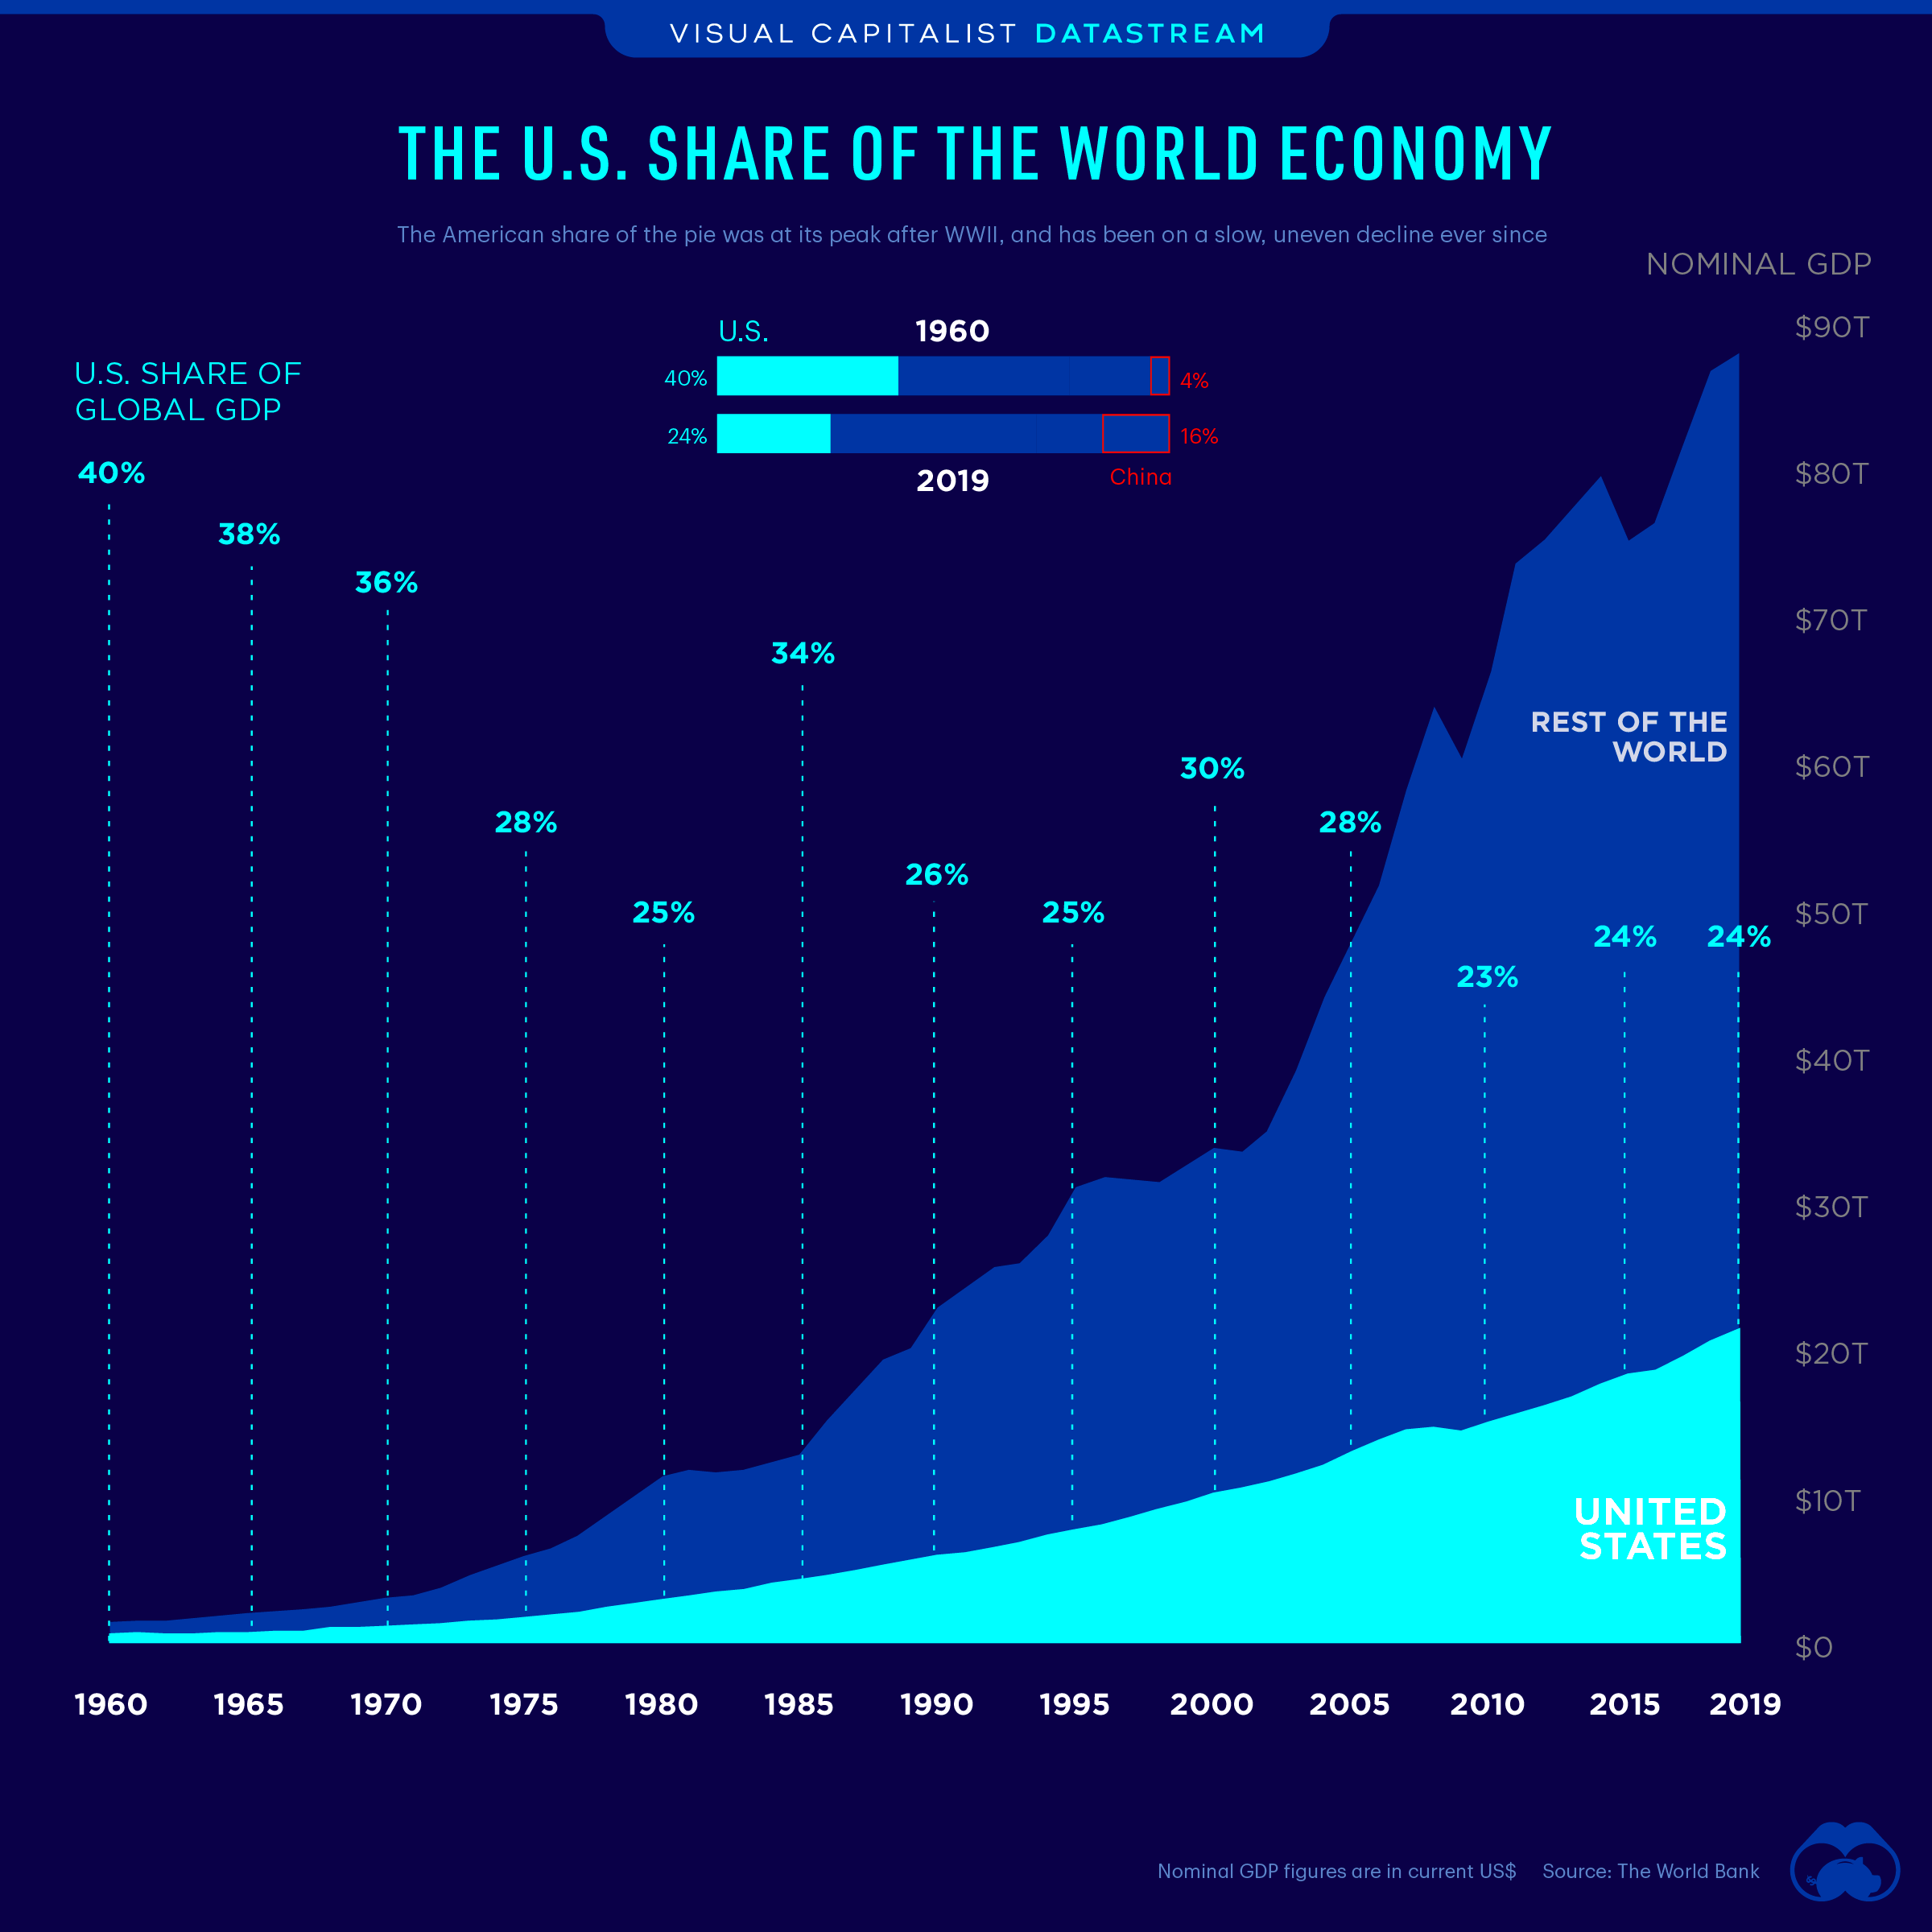
([source](https://www.visualcapitalist.com/u-s-share-of-global-economy-over-time/))
Isn’t it puzzling that the US still makes up 60% of the global stock market?
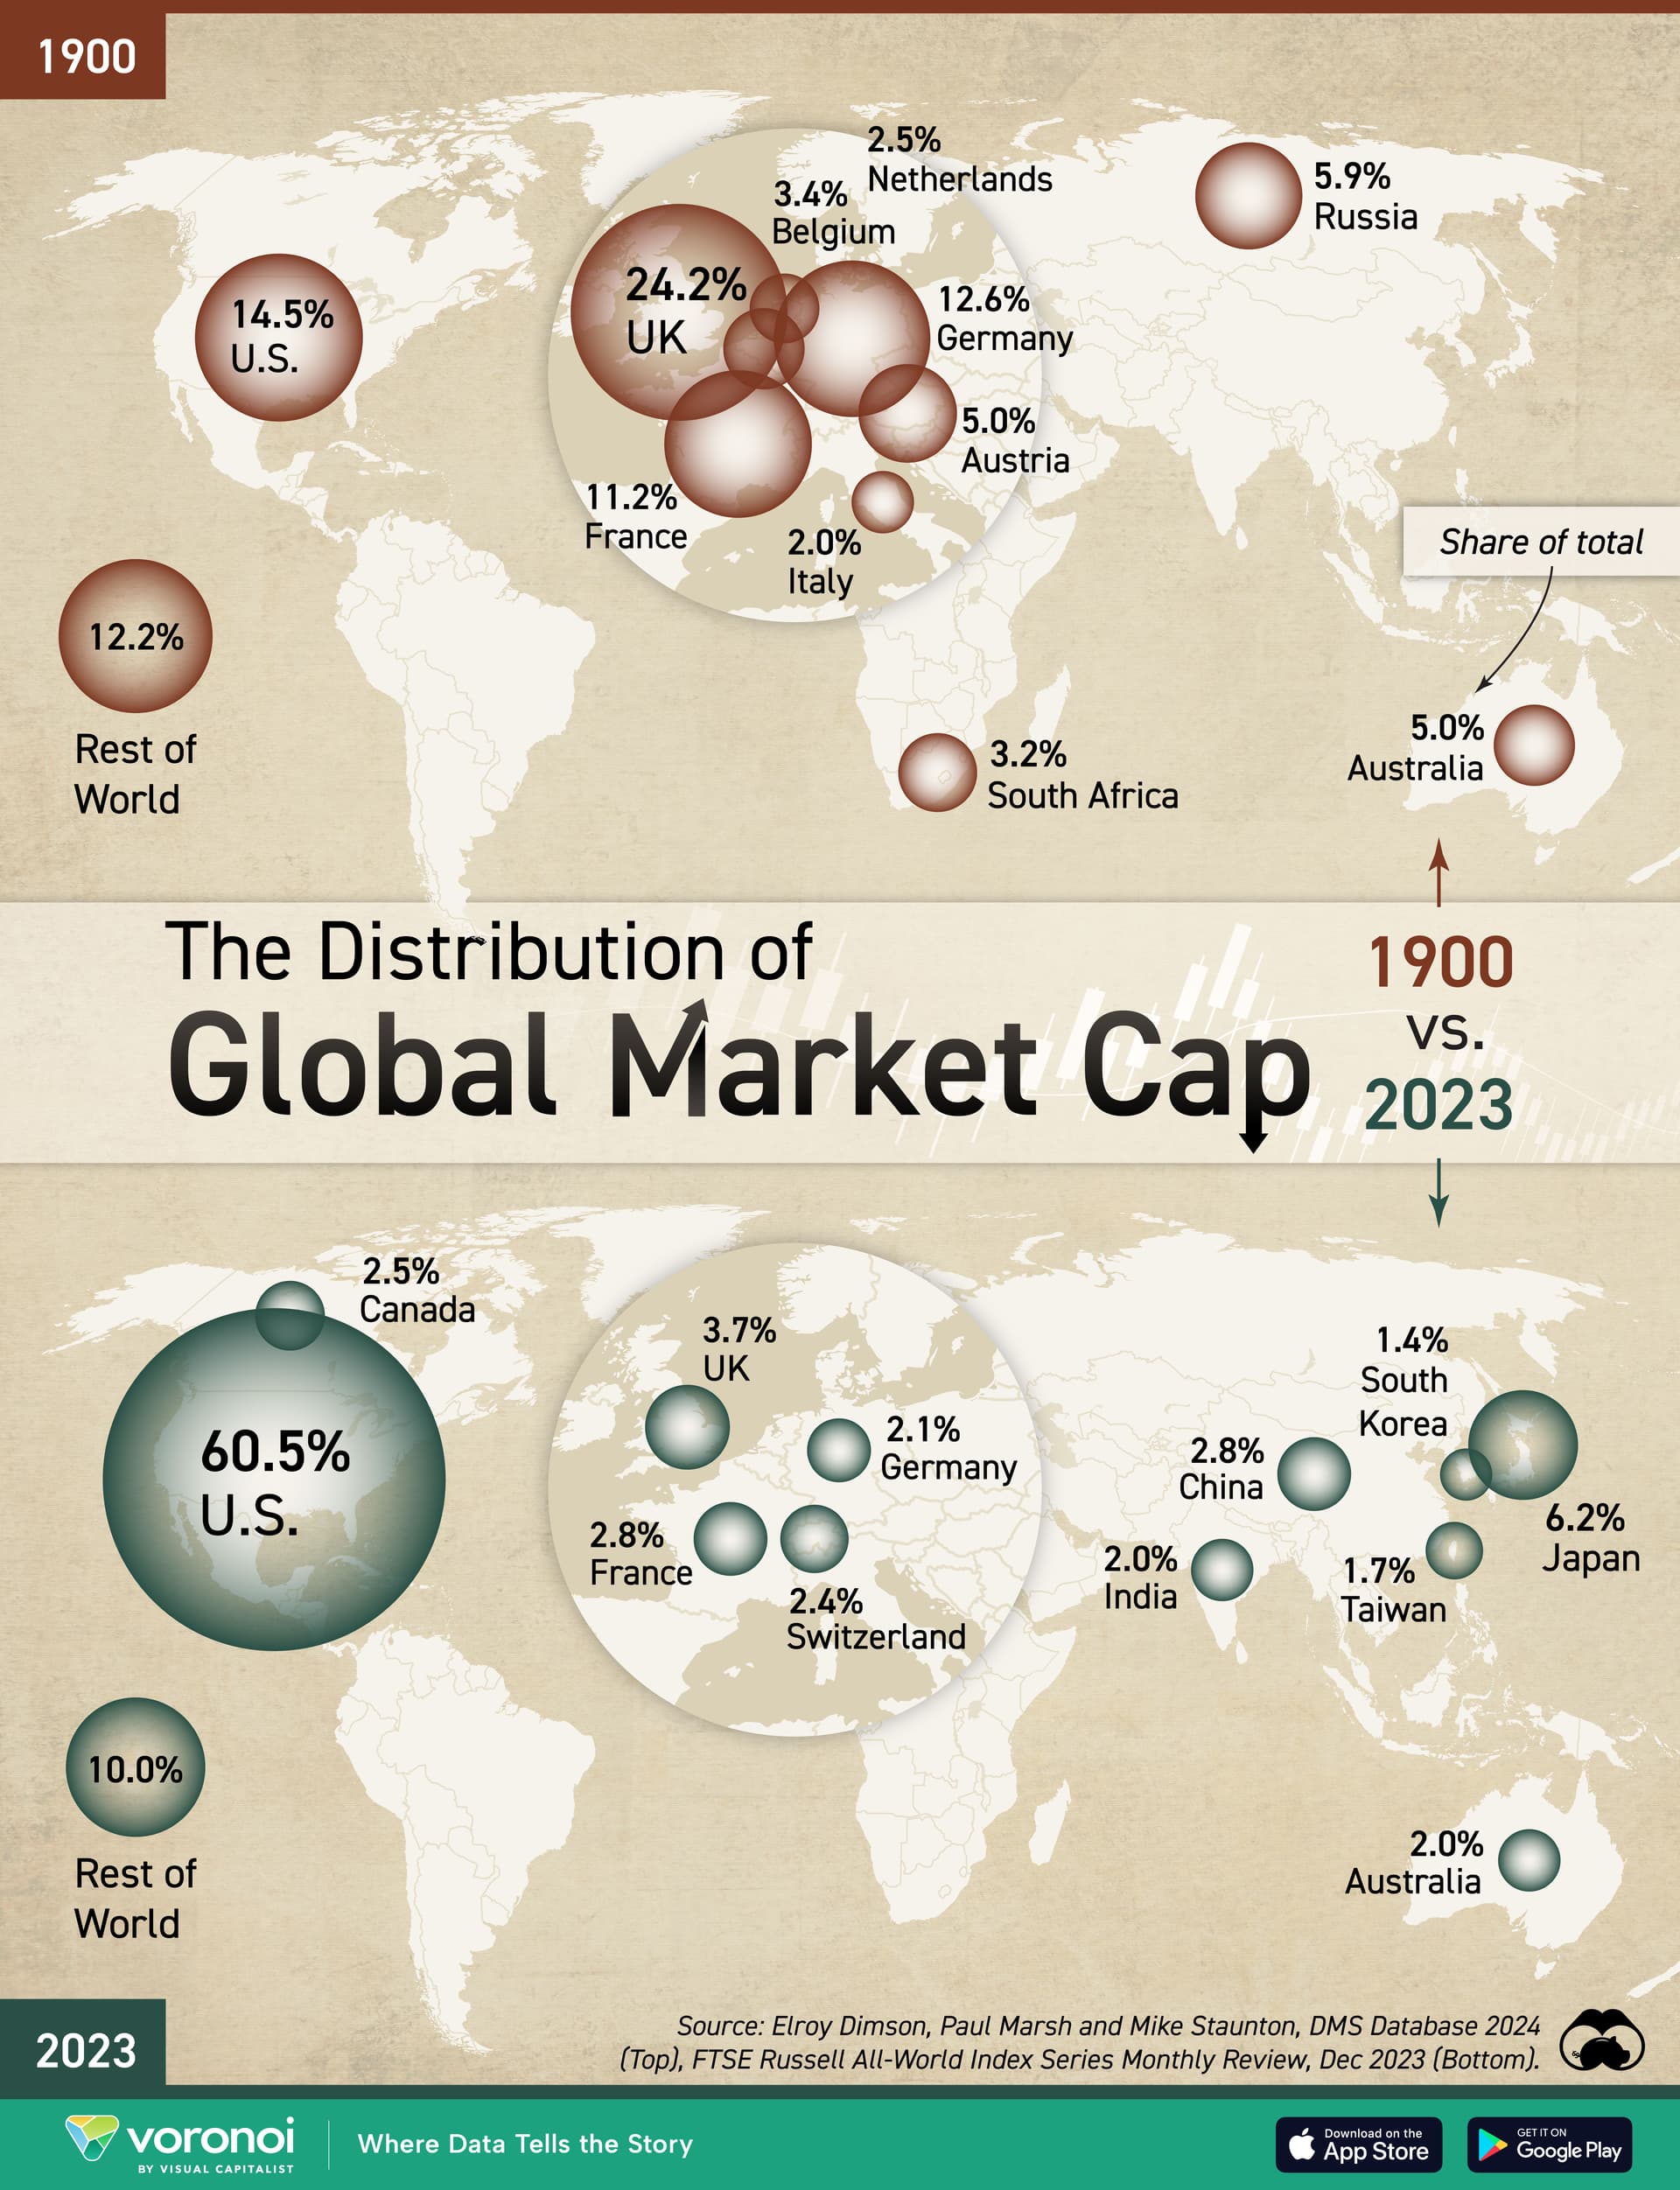
([source](https://www.visualcapitalist.com/mapped-the-worlds-largest-stock-markets-1900-vs-2023/))
And the share has been growing steadily since about the late 80’s:
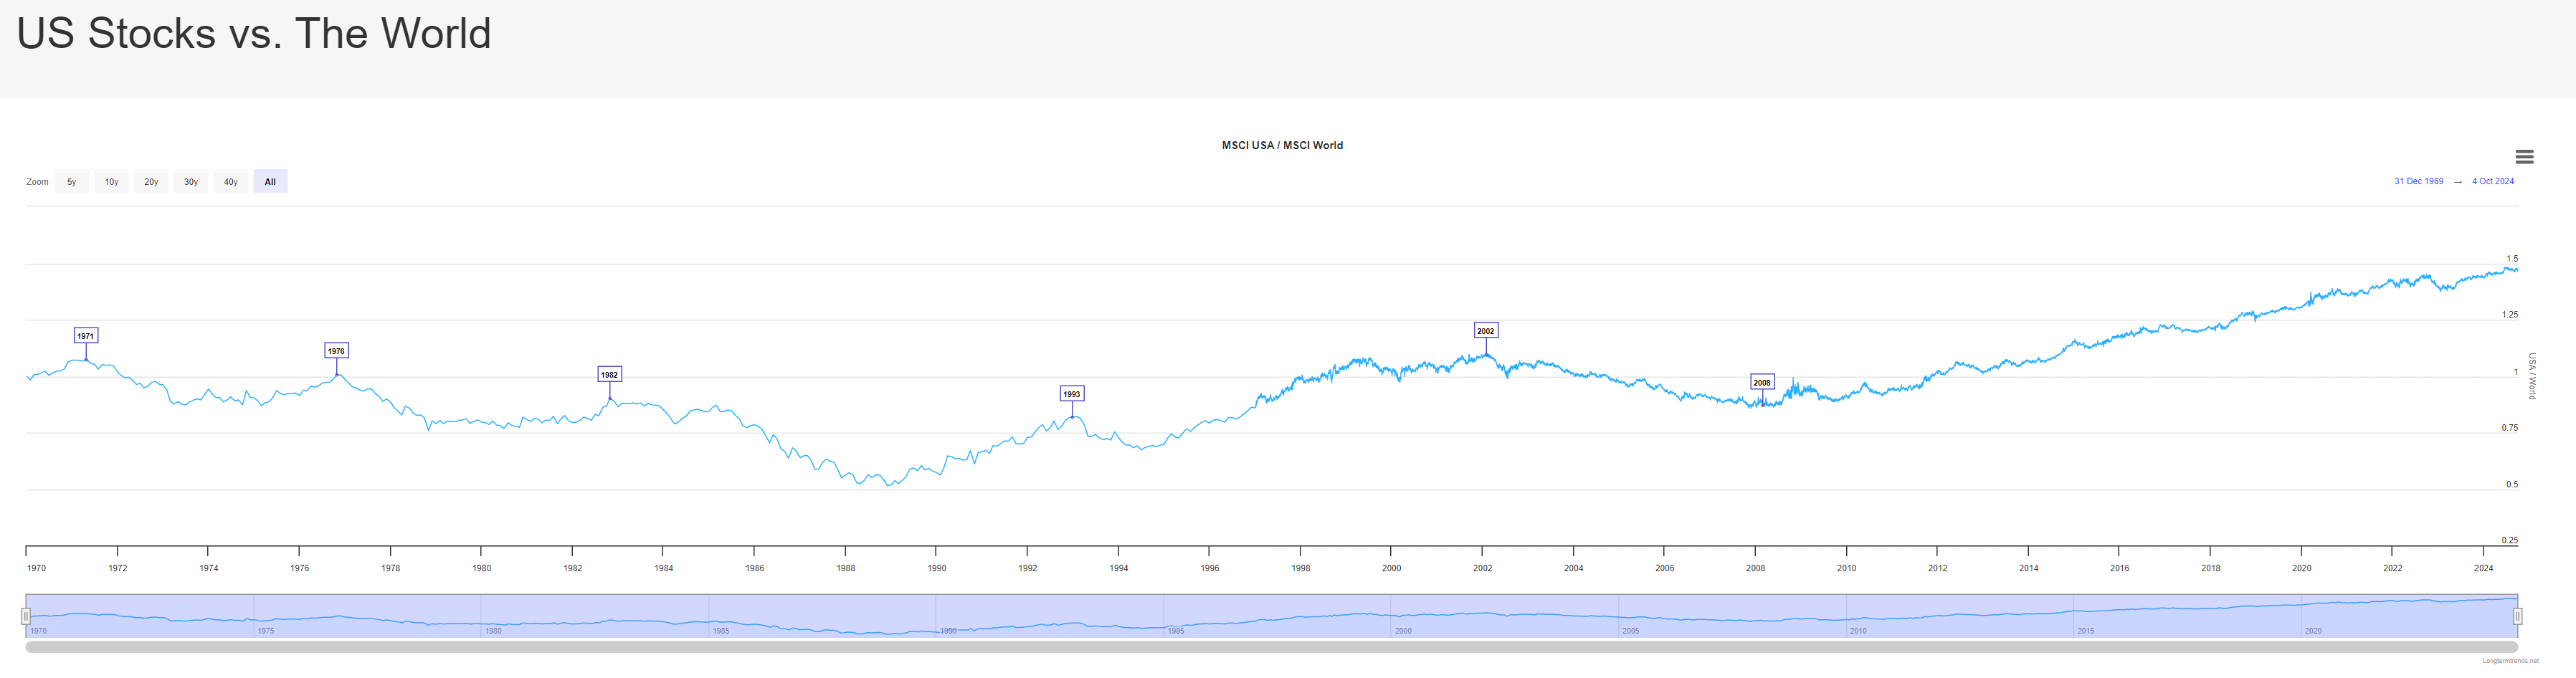
([source](https://www.longtermtrends.net/msci-usa-vs-the-world/))
---
### Author:  [@Abs\_max](https://forum.mustachianpost.com/u/Abs_max)
#### Post date: [October 11, 2024, 12:49pm UTC](https://forum.mustachianpost.com/t/coffee-history-and-histories-historical-data-charts-long-term-trends-in-investment/8693/80 "2024-10-11T12:49:39Z")
I think it’s driven by two factors
- higher valuation of US companies vs their revenue
- world index are based on free float as far as I understood. I think lot of companies in Asia might not have everything in public domain
---
### Author:  [@Dr.PI](https://forum.mustachianpost.com/u/Dr.PI)
#### Post date: [October 11, 2024, 1:09pm UTC](https://forum.mustachianpost.com/t/coffee-history-and-histories-historical-data-charts-long-term-trends-in-investment/8693/81 "2024-10-11T13:09:51Z")
> [@anon17469660](#):
>
> Isn’t it puzzling that the US still makes up 60% of the global stock market?
Nope. These are different things. Why don’t you look up the same data for Switzerland? 😈
---
### Author:  [@anon17469660](https://forum.mustachianpost.com/u/anon17469660)
#### Post date: [October 11, 2024, 1:53pm UTC](https://forum.mustachianpost.com/t/coffee-history-and-histories-historical-data-charts-long-term-trends-in-investment/8693/82 "2024-10-11T13:53:41Z")
I guess you’re right, they’re different things.
I still find it amazing that most of the rest of the world doesn’t … well, guess, _capitalize?_ on their much larger economy.
---
### Author:  [@Patirou](https://forum.mustachianpost.com/u/Patirou)
#### Post date: [October 11, 2024, 2:32pm UTC](https://forum.mustachianpost.com/t/coffee-history-and-histories-historical-data-charts-long-term-trends-in-investment/8693/83 "2024-10-11T14:32:42Z")
> [@anon17469660](#):
>
> well, guess, _capitalize?_ on their much larger economy.
They do, just not on the stock market.
---
### Author:  [@anon17469660](https://forum.mustachianpost.com/u/anon17469660)
#### Post date: [October 11, 2024, 2:41pm UTC](https://forum.mustachianpost.com/t/coffee-history-and-histories-historical-data-charts-long-term-trends-in-investment/8693/84 "2024-10-11T14:41:37Z")
But do they, really?
Maybe in absolute nominals the rest of the world (ROW) has benefitted significantly,\* but in relative terms compared to the US, I cannot help myself but wonder …
Anyhow, I have no numbers (or charts) to back this, just my gut feeling.
* * *
\* Well, there’s also somewhat capitalized countries in Europe that are probably seeing declines …
[Previous page](https://forum.mustachianpost.com/t/coffee-history-and-histories-historical-data-charts-long-term-trends-in-investment/8693.md?page=3)
[Next page](https://forum.mustachianpost.com/t/coffee-history-and-histories-historical-data-charts-long-term-trends-in-investment/8693.md?page=5)