I like history and I think everyone should have an idea about the past. I saw recently one historical chart and have thought it would be interesting to collect some investment related (50y+ or so) ones. For a general education and as a help to disperse FUD. I can imagine we can also discuss what’s wrong with them.
There were already various charts posted throughout the forum, and if we can collect them in one place, it would be nice I think.
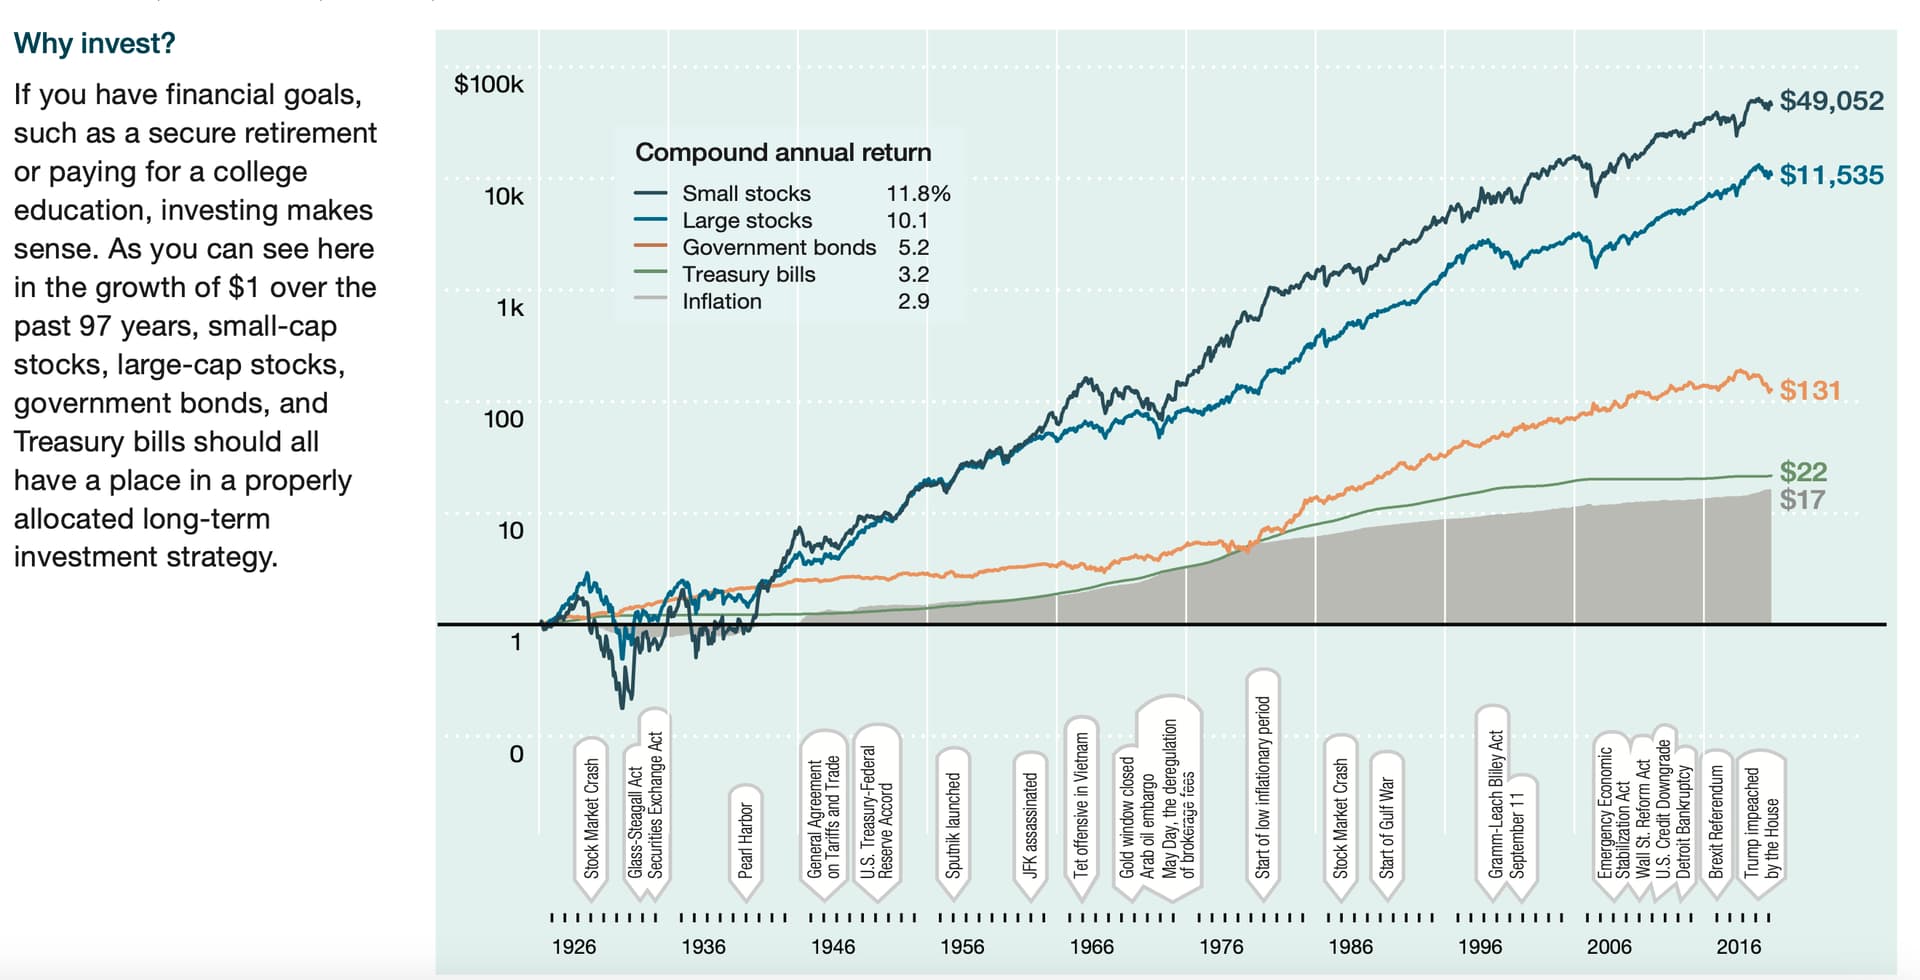
This chart showin the historical development of Dow Jones index overlaid with various historical events. Extremely US biased, of course, but still very instructive I think.
It is correct that Dow Jones is the oldest stock market index, but unfortunately it means that the way it is constructed is really terrible. First it’s a price Index, so in theory the value is obtained by summing-up prices of underlying components. A more correct way is a market capitalization weighting. There are some kind of weights used to calculate DJI nowadays, but I don’t think there were many options in 1896.
Second it doesn’t count in reinvested dividends, which one should do to obtain the total return. This is a common problem with stock market indices anyway. So when chart’s author writes that it took 25 years to recover from the great depression, this is wrong. A portfolio with reinvested dividends would recover faster.
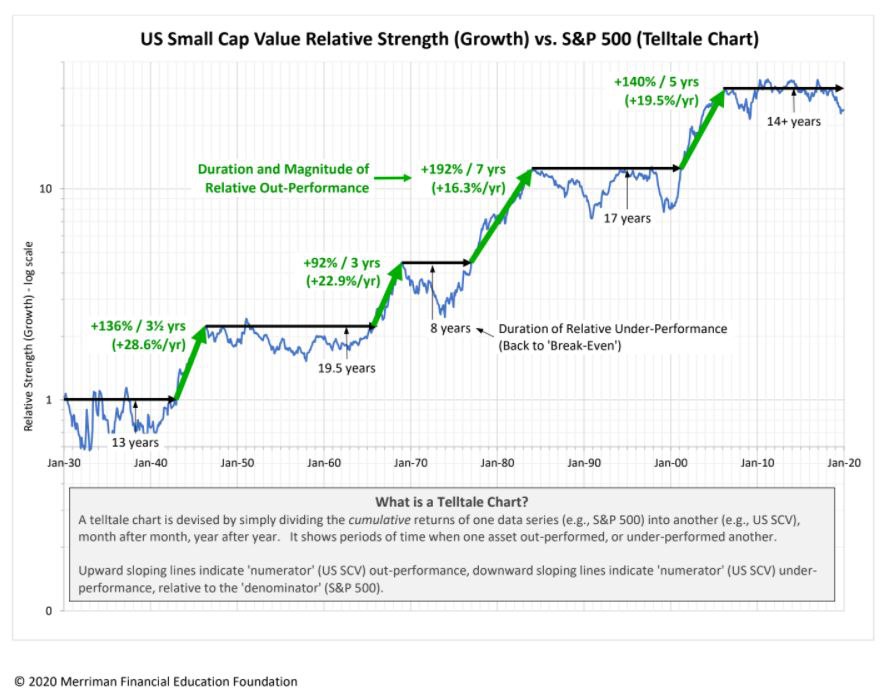
This one shows 90 years of US small cap value divided by SNP 500.
The main point being that there are very long periods where you have to endure the pain and stick to your strategy to be compensated.
Caveat, in the past there was no actual fund that you could pick to execute this strategy for you.
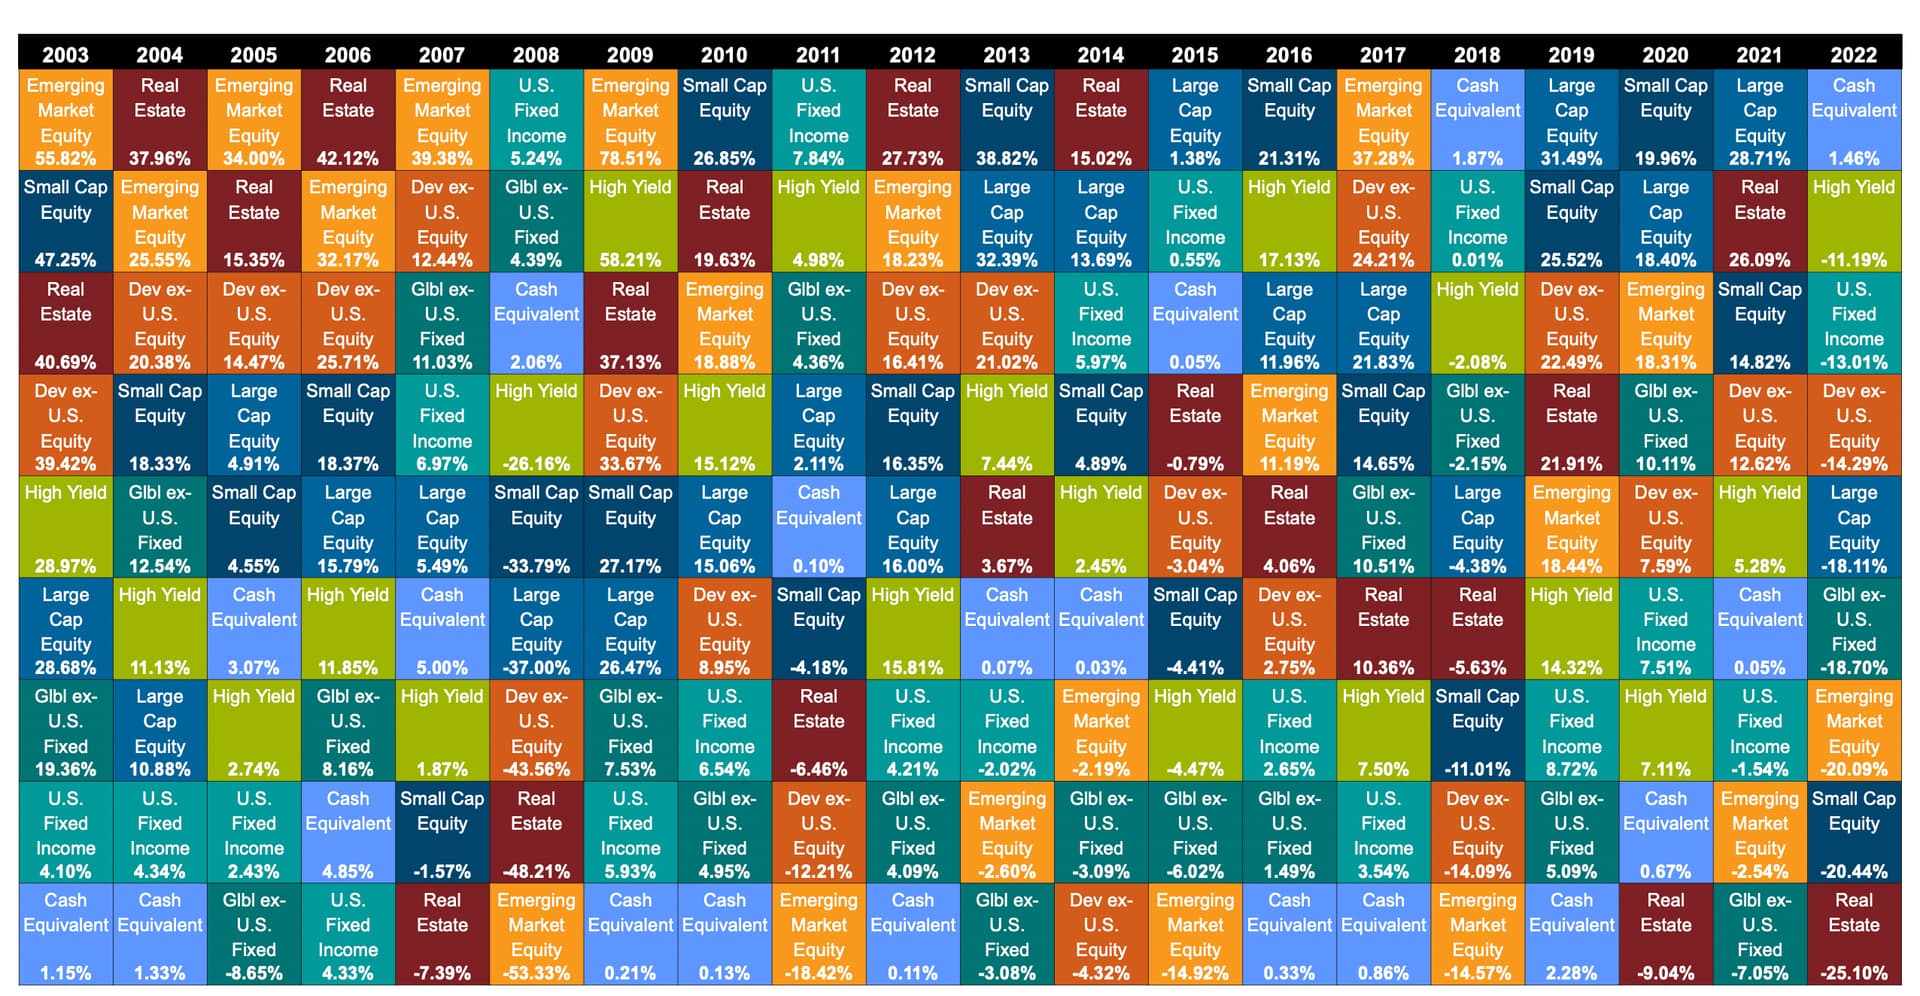
I found the ‘Periodic Table of Investment Returns’ instructive, which lists the returns for various asset classes sorted by performance. It reminds me to not try to predict the next winner and just have a slice of the world market instead.
Certainly a great strategy.
But to compare the different returns, you‘d have to add each years return for every asset class, not which asset class was in 1st place most often.
By reading and partipating to this forum, you confirm you have read and agree with the disclaimer presented on http://www.mustachianpost.com/
En lisant et participant à ce forum, tu confirmes avoir lu et être d'accord avec l'avis de dégagement de responsabilité présenté sur http://www.mustachianpost.com/fr/
Durch das Lesen und die Teilnahme an diesem Forum bestätigst du, dass du den auf http://www.mustachianpost.com/de/ dargestellten Haftungsausschluss gelesen hast und damit einverstanden bist.