OK, I will try to see how I can put my table online.
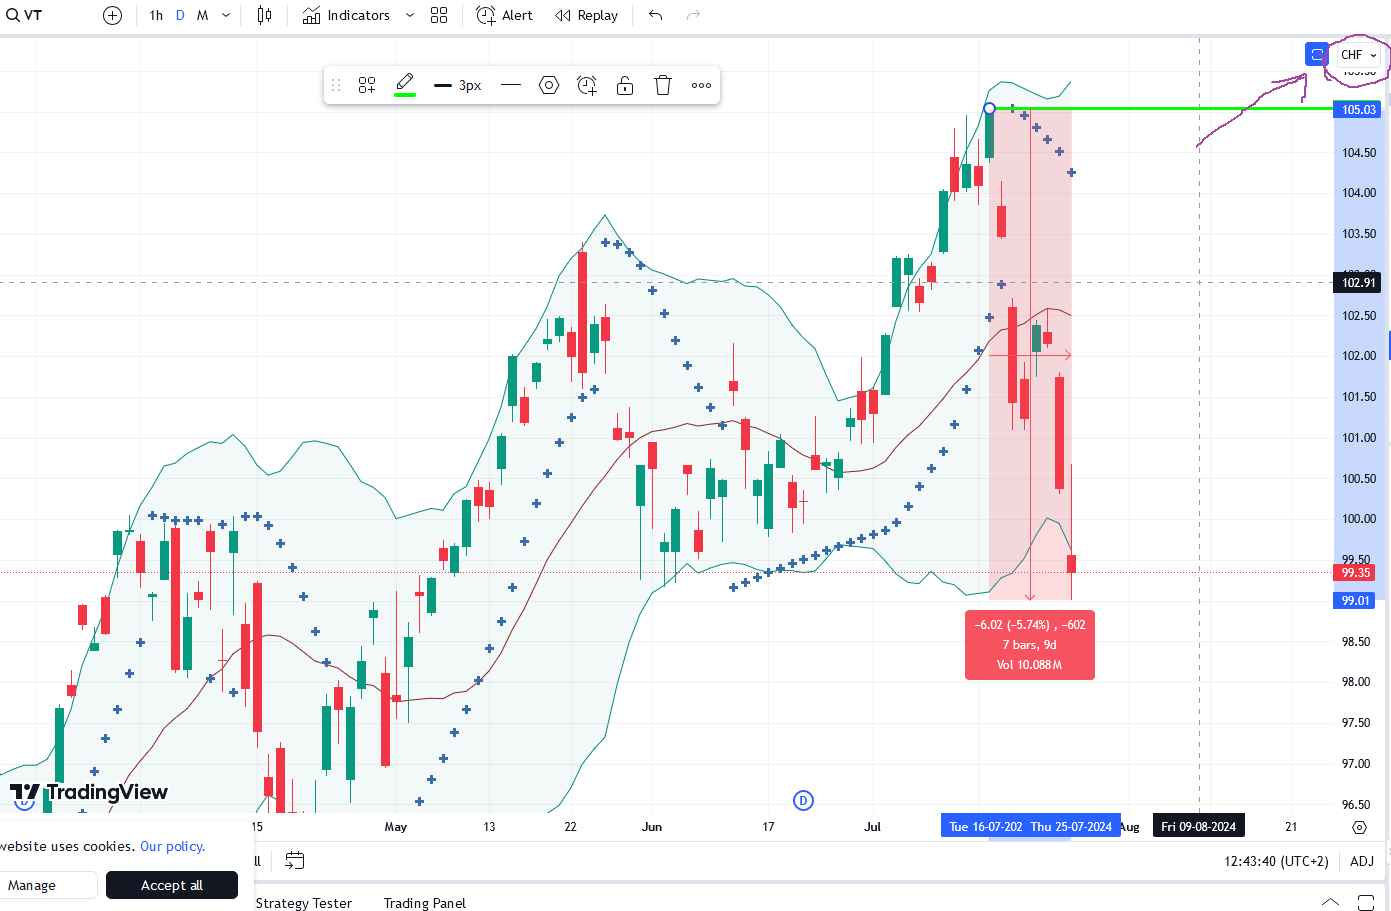
Yes, this is a good idea. Personally, as a short-term indicator, I prefer VT in CHF, because European stock exchanges are closing before the major part of US trading takes place. And we know which country has the largest share of the global market.
There are smaller exchanges still open till 10pm, exact time when New York closes. Like Gettex Munich. So prices should still be updated accordingly I think. Maybe not a CHF ticker though, haven’t checked.
There is an “adjustment for dividends”, which is not the same. But I use it as a short term (days and weeks) indicator to watch 3+% movements, and if there is a 0.5% hiccup once per 3 months, I think it’s OK.
VT in CHF is also not that precise. It is not clear which exactly FX rates TradingView applies. If you change the interval, values like intraday highs and lows are slightly changing. But, it’s good enough for an overview.
P.S. Concerning watching VT movements, although I am not zen enough to not look at all, I manage to not do anything else (like, check the benchmark and calculate the portfolio size) if VT (in USD or CHF, not so important) remains within the Bollinger Bands.
What I’d like to have/see/play around with is index data including dividends in CHF, corrected and not corrected for inflation, for as many years as possible, preferably both with and without EM, and preferably per month.
Would one need to get MSCI World and ACWI index values, USD exchange rates and LIK separately and then build a chart? Where do you get your info from?
MSCI already provides indices in CHF.
If you want to research long-term development (I want to but have no time), MSCI World is the longest-running global stocks index.
All indices are here:
Select an index, it will open a graph.
Select the interval of interest, Index Level, Frequency.
Leave currency USD at this stage.
Update the graph.
Now a tricky part.
Switch currency to CHF.
Press “Update”.
You get an error message.
Scroll up and find a “Download data” field above the plot.
Download this file and you get your data in CHF as a table.
Thank you. Now what would make most sense here, selecting the Net or Gross variant? As Swiss investors, we get WHT back, but only of US titles. So Net just to be on the safe side?
You refer to the Level 1 + level 2 withholding taxes, but there is also the personal income tax. So, I use Net, because it is the most realistic of these three, I find.
I will repeat again that I don’t claim precision in measuring global markets. All these 0.1% changes is my personal indulgence in calculating things. The employed model, a “translation” of, say, underlying physical/economic system (global stocks market) into a quantifiable property (index) hardly justifies such precision.
My benchmark of the global stocks market is “MSCI ACWI IMI Net Total Return in CHF” as calculated by MSCI. To adjust it for the inflation, I divide its value in CHF by the value of “Landesindex der Konsumentenpreise (LIK)” (“Swiss CPI”) for the previous month.
The latest ATH of 2121.76 CHF nominal was reached on 16.07.2024. The YTD gain was +22.1% in nominal CHF, +20.3% in inflation-adjusted CHF.
LIK for July went down a bit and changed by -0.18% m/m.
The benchmark has pulled back with a minimum of 1843.76 CHF nominal reached on 5.8.2024, as evident by 142 messages posted in this thread around this date. The decline from ATH was -13.1% nominal and -12.9% inflation-adjusted, corresponding to “Correctio Vulgaris”. The YTD gain was +6.1% in nominal CHF, +4.7% in inflation-adjusted CHF.
As per yesterday, 14.08.2024, my benchmark stands at 1975.243 CHF nominal. It has moved +7.1% (both nominal and inflation-adjusted) from the 5.8.2024 minimum and stands at -6.9% nominal and -6.7% inflation-adjusted from ATH. This is again the “Mild Correction” regime. The YTD gain is +13.6% in nominal CHF, +12.2% in inflation-adjusted CHF.
That is a very good question, thank you. Mostly as a matter of practicality.
Note that the consumer price indices for a month show how much consumer prices have changed during the month and is calculated after the month is finished.
I want to use inflation adjustment “in real time” and not to wait until the next month to see where we were on the inflation adjusted basis a month before. So I use the index value for the previous month.
You can also see it like this: the inflation is accumulated during the month and we get an index value corresponding to the end of the month. From the beginning of a new month, the purchasing power of our money is (typically) lessened by the increase of prices accumulated in the previous month.
Moreover, the price index changes little from month to month. The inflation effect becomes important over years. I am looking at relative changes of the inflation adjusted benchmark, so as long as I calculate it consistently, it is good enough for my purposes.
For the calculations I did for various indices (see here) I used month-end values for the indices and exchange rates, so I had to wait for the month to be over anyway.
Mit dem Lesen und der Teilnahme an diesem Forum bestätigst du, dass du die Forum-Richtlinien gelesen hast und damit einverstanden bist sowie den Haftungsausschluss auf http://www.mustachianpost.com/de/ akzeptierst.