# Benchmarking The Market
**URL:** https://forum.mustachianpost.com/t/benchmarking-the-market/15991
**Category:** Investing / Others
**Created:** [October 1, 2022, 9:32am UTC](https://forum.mustachianpost.com/t/benchmarking-the-market/15991 "2022-10-01T09:32:31Z")
**Posts on this page:** 20
**Page:** 1
### Author:  [@Dr.PI](https://forum.mustachianpost.com/u/Dr.PI)
#### Post date: [October 1, 2022, 9:32am UTC](https://forum.mustachianpost.com/t/benchmarking-the-market/15991/1 "2022-10-01T09:32:31Z")
New benchmark!
> [@When do we reach the bottom of the dip? (2022-24 Edition)](https://forum.mustachianpost.com/t/when-do-we-reach-the-bottom-of-the-dip-2022-24-edition/7762/432):
>
> MSCI ACWI IMI Net total Return in CHF.
I downloaded values in USD and applied USD CHF rates as fetched by Excel 😁. Some key pivots:
19.02.2020, 1870.02 CHF, pre-covid ATH.
23.03.2020, 1227.43 CHF, COVID bottom. -34.4% from ATH.
16.11.2021, 2390.48 CHF, latest ATH. +94.8% from the COVID bottom, +27.8% from the previous ATH.
16.06.2022, 1926.15 CHF, June’s low. -19.4% from ATH.
18.08.2022, 2142.8 CHF, August’s high. -10.4% from ATH, +11.2% from June’s low.
29.09.2022, 1862.75 CHF, current (almost) 2 years’ low. -22.1% from ATH, -13.1% from August’s high.
What I find interesting is:
- only right now we are sitting exactly at pre-covid ATH.
- COVID crash was fast and deep, the recovery was also fast and strong. Thank you central banks (or not).
- In CHF terms, we have only very recently reached -20% from ATH.
- in comparison with the COVID crash, we still have like -16% to go from the current minimum to reach the same relative depth. Doesn’t mean anything though, just a remark to those complaining about unbearable bear market. 🤣
---
### Author:  [@Dr.PI](https://forum.mustachianpost.com/u/Dr.PI)
#### Post date: [November 3, 2022, 8:54am UTC](https://forum.mustachianpost.com/t/benchmarking-the-market/15991/2 "2022-11-03T08:54:25Z")
VT in CHF has reached a new 23 months minimum on October 13th before being catapulted +5% in the same day. With respect to MSCI ACWI IMI Net total Return in CHF, which is calculated once per day from closing prices, we have stayed above September 29th minimum at 1861.75 CHF.
November 1st looks like a new intermediate maximum at 2016.2 CHF, -15.7% from ATH and +8.3% from September’s minimum. It could be that a new round of the game have started and this level could be a key pivot (no, not that one).
---
### Author:  [@Dr.PI](https://forum.mustachianpost.com/u/Dr.PI)
#### Post date: [January 14, 2023, 12:10am UTC](https://forum.mustachianpost.com/t/benchmarking-the-market/15991/3 "2023-01-14T00:10:26Z")
My benchmark (and now I add: for the accumulation phase that I am now in) remains “MSCI ACWI IMI Net total Return in CHF”, but I have figured out how to get from MSCI these data already calculated in CHF, and that’s what I am going to use. Hardly any difference to the course of the market described above, just different numbers.
A quick recapitulation of some key pivots.
Last ATH, 16.11.2021, already 14 months ago: 1947.97 CHF
After that my benchmark was zigzagging down in a downward channel, with lower lows and lower highs, like in a textbook of technical analysis.
3.12.2021: 1836.22 CHF, -5.7% from ATH.
3.01.2022: 1918.04 CHF, -1.5% from ATH.
25.01.2022: 1773.806 CHF, -8.9% from ATH.
9.2.2022: 1865.79, -4.2% from ATH.
8.3.2022: 1683.202 CHF, -13.6% from ATH.
Some fast forward
20.6.2022: 1573.44 CHF, -19.2% from ATH.
16.8.2022: 1748.164 CHF, -10.3% from ATH.
30.09.2022: 1522.11 CHF, -21.9% from ATH.
30.11.2022: 1683.08 CHF, -13.6% from ATH.
28.12.2022: 1561.776 CHF, -19.8% from ATH.
So, my benchmark was zigzagging in a downward channel (lower lows and lower highs) until December, and the time between two lows was around 3-4 months. However in December a new low was not lower than the previous one. All major indices show a very similar picture.
Now I can make my forecast: if in next two months we won’t get a new low lower than the September’s/October’s one, we might had already left the bottom behind us. It would be even better if we come back to a new high, which is higher than end of November’s/December’s one. That would correspond to the second zig (zig higher - zag lower - zig higher) in an upward channel, and one can expect that many technically-oriented traders and bots will jump into the party.
---
### Author:  [@Dr.PI](https://forum.mustachianpost.com/u/Dr.PI)
#### Post date: [February 8, 2023, 4:24pm UTC](https://forum.mustachianpost.com/t/benchmarking-the-market/15991/4 "2023-02-08T16:24:43Z")
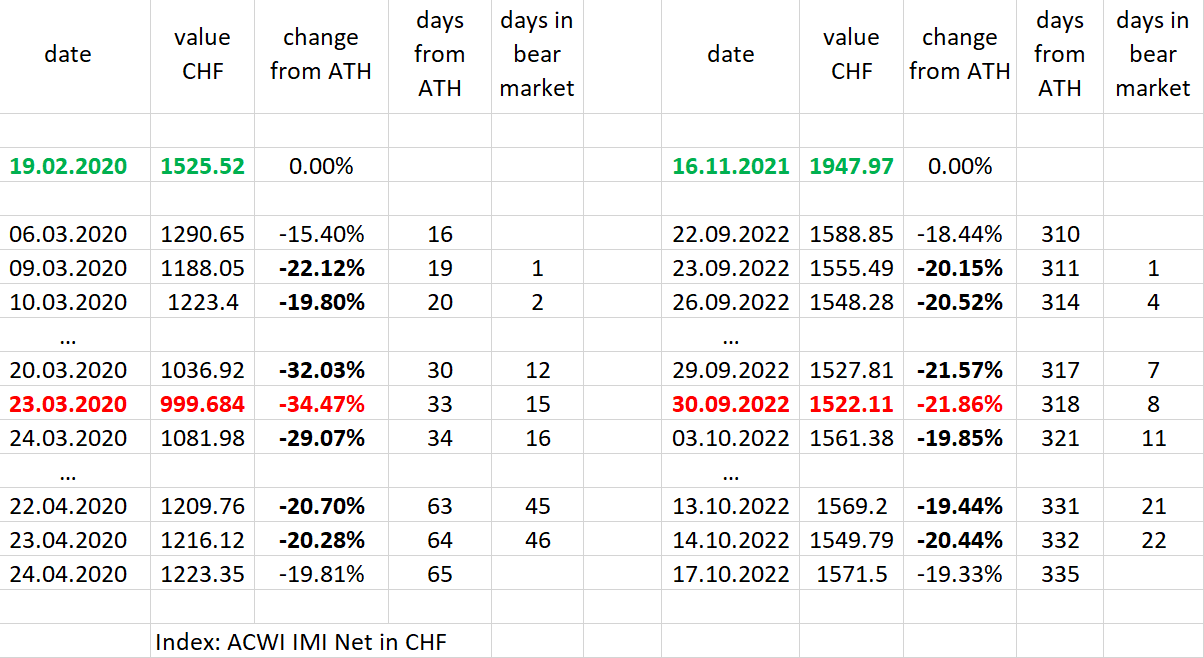
I keep playing with my benchmark. According to it, in 2022 it took longer than in 2020 to reach -20% from ATH, but the time below this level was actually shorter (well, for now). I think any broad index will show similar results.
---
### Author:  [@Dr.PI](https://forum.mustachianpost.com/u/Dr.PI)
#### Post date: [February 25, 2023, 10:43am UTC](https://forum.mustachianpost.com/t/benchmarking-the-market/15991/5 "2023-02-25T10:43:22Z")
> [@Dr.PI](#):
>
> 16.8.2022: 1748.164 CHF, -10.3% from ATH.
> 30.09.2022: 1522.11 CHF, -21.9% from ATH.
> 30.11.2022: 1683.08 CHF, -13.6% from ATH.
> 28.12.2022: 1561.776 CHF, -19.8% from ATH.
Now it is clear that we have passed a local maximum and seem to have started a distinct leg down.
03.02.2023: 1704.462 CHF, -12.5% from ATH, +12% from the 30.09.2022 bottom, 8.5% YTD.
The new local maximum went around 1.5% higher from the bottom than the previous one in November.
Getting into a technical analysis mode, we had hit a resistance at 50% retracement level and bounced back.
---
### Author:  [@kraphael](https://forum.mustachianpost.com/u/kraphael)
#### Post date: [February 26, 2023, 10:52am UTC](https://forum.mustachianpost.com/t/benchmarking-the-market/15991/6 "2023-02-26T10:52:26Z")
> [@Dr.PI](#):
>
> Getting into a technical analysis mode, we had hit a resistance at 50% retracement level and bounced back.
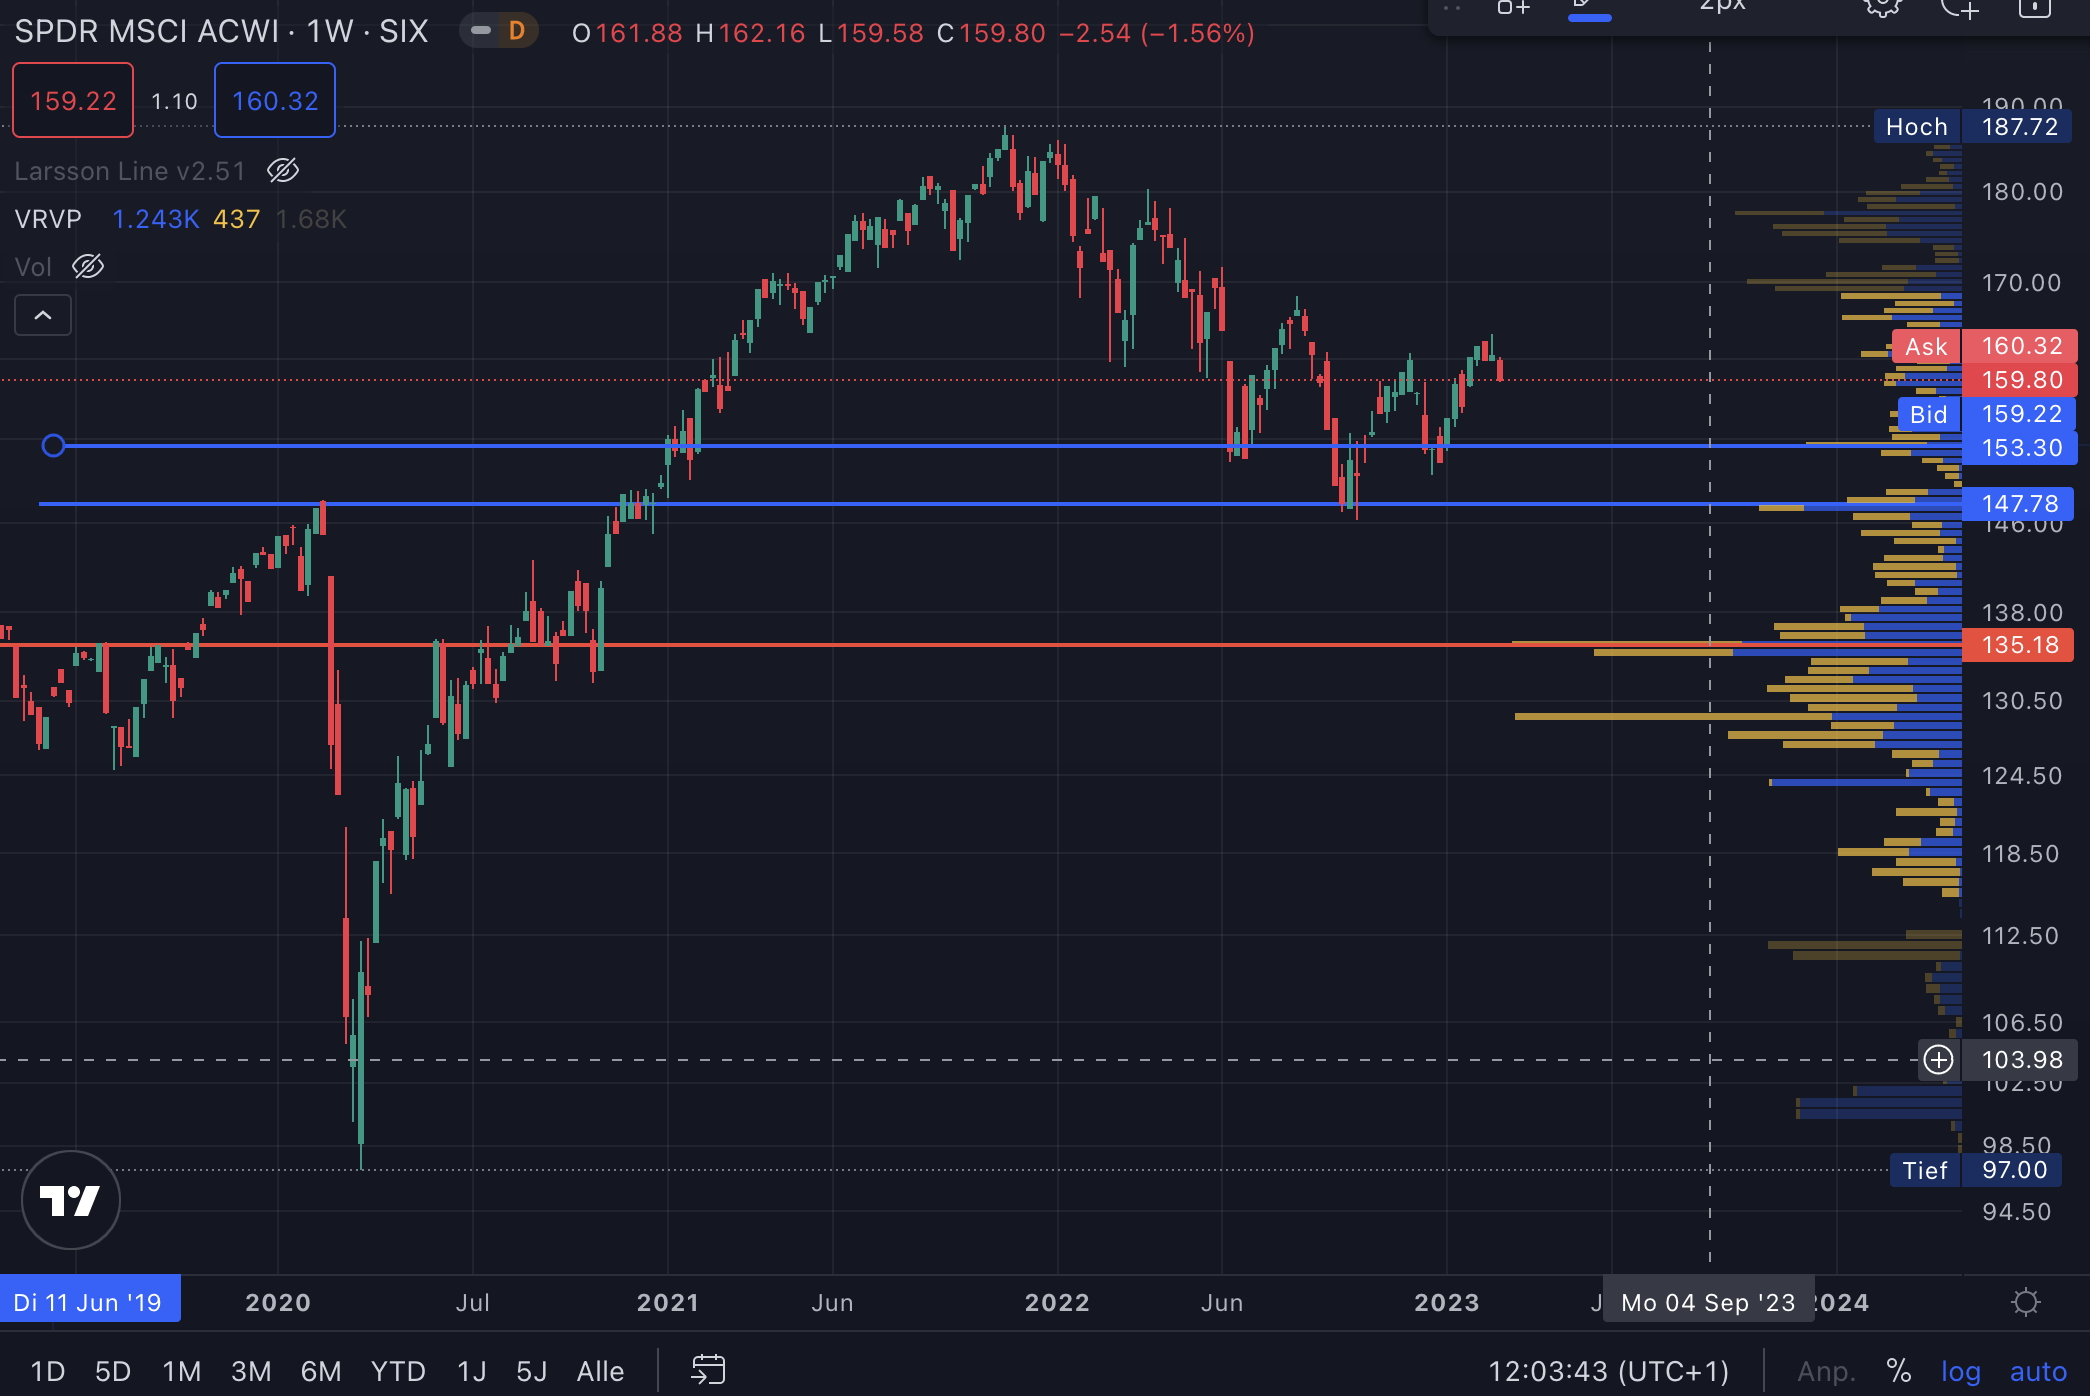
i think we might see a 6,5% retracement (to 1590 CHF according to your calculations) before we bounce, there is quite big support level there. if that doesen’t hold we will probably go down to the october lows, if that breaks we have a problem there is quite a big gap after that.
You might want to put a stoploss around there. 😱
I still think it doesn’t look too bad, medium term trend is still up. Just ignore the FUD of the media.
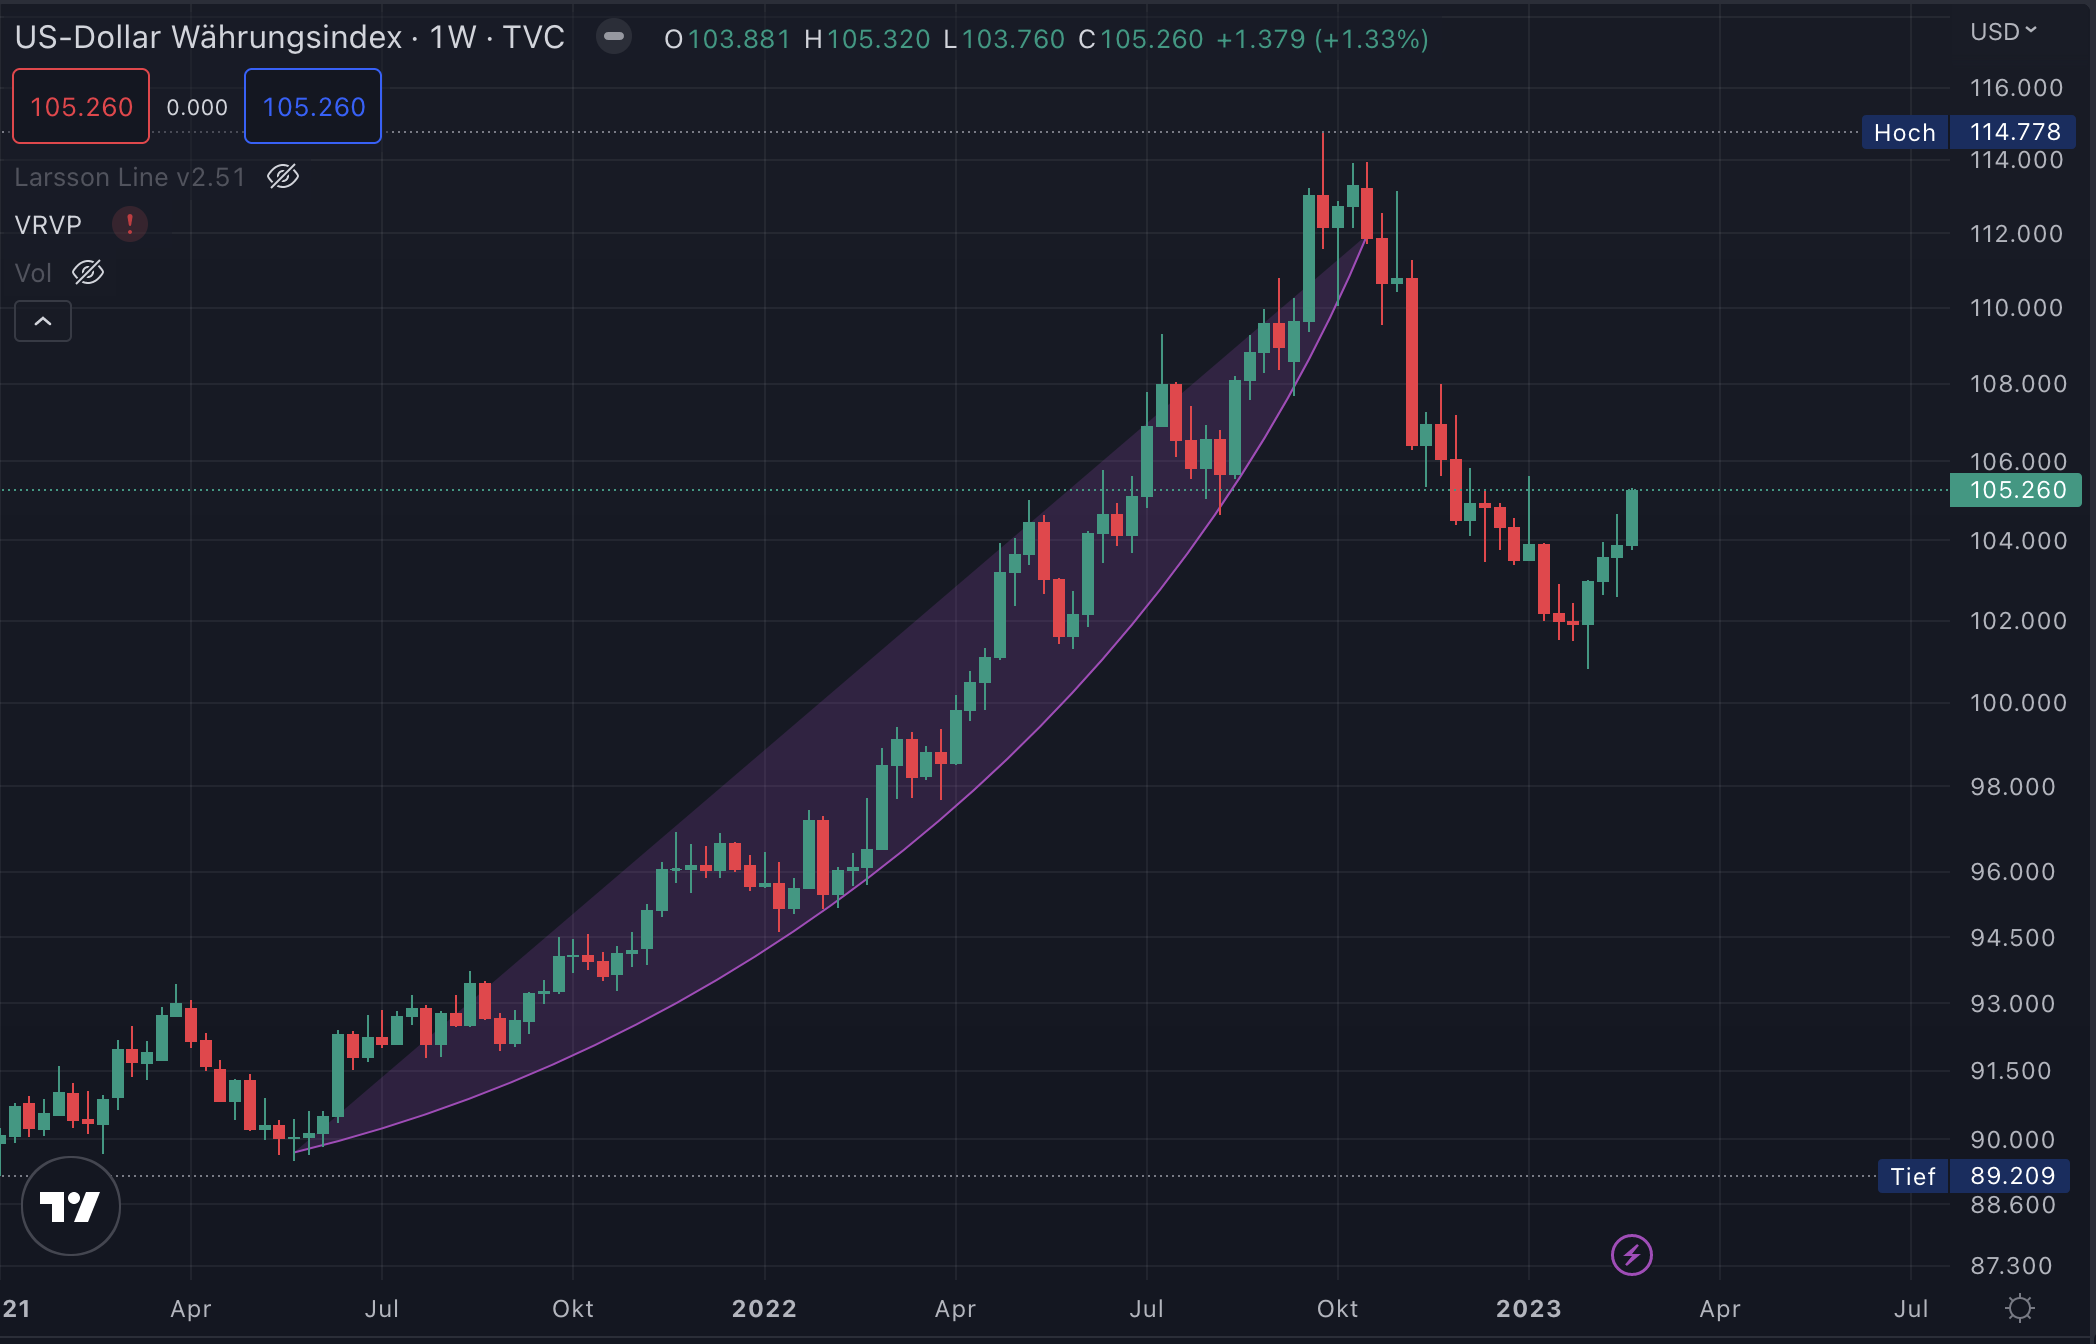
Also USD is on the rise again that works in our favour as non US investors
---
### Author:  [@Dr.PI](https://forum.mustachianpost.com/u/Dr.PI)
#### Post date: [March 12, 2023, 10:32am UTC](https://forum.mustachianpost.com/t/benchmarking-the-market/15991/7 "2023-03-12T10:32:03Z")
> [@Dr.PI](#):
>
> 28.12.2022: 1561.776 CHF, -19.8% from ATH.
> [@Dr.PI](#):
>
> 03.02.2023: 1704.462 CHF, -12.5% from ATH, +12% from the 30.09.2022 bottom, 8.5% YTD.
10.3.2023: 1595.84 CHF, -18.1% from ATH, +4.8% from the 30.09.2022 bottom, 1.5% YTD, -6.5% from the previous pivot.
The pull back came later than I thought. End of January I thought my benchmark is going to peak here and pull back by 5-6% in 2-3 weeks. Instead it still went up a bit and then it took 5 weeks to decrease substantially.
Major indices don’t look oversold (TradingView, stochastic RSI with the standard settings on daily close prices). I wonder if the markets are going down more and if we are going to see negative YTD changes and especially if we are going below December’s minimum. Or things will calm down over the weekend and there won’t be a new substantial decrease.
---
### Author:  [@Dr.PI](https://forum.mustachianpost.com/u/Dr.PI)
#### Post date: [March 26, 2023, 6:47am UTC](https://forum.mustachianpost.com/t/benchmarking-the-market/15991/8 "2023-03-26T06:47:31Z")
30.09.2022: 1522.11 CHF, -21.9% from ATH.
30.11.2022: 1683.08 CHF, -13.6% from ATH.
28.12.2022: 1561.776 CHF, -19.8% from ATH.
03.02.2023: 1704.462 CHF, -12.5% from ATH, +12% from the 30.09.2022 bottom, 8.5% YTD.
Looks like the minimum of the previous leg down was
13.3.2023: 1574.97 CHF, -19.1% from ATH, +3.5% from the 30.09.2022 bottom, 0.2% YTD, -7.7% from the previous pivot.
Indices looked oversold around those dates, but it still doesn’t look like the leg up had definitely started. But, as we know, we can’t really successfully identify a market move until it is in an advanced stage already.
However the technical setup for now still looks good. There haven’t been negative YTD returns. For now major indices keep producing higher highs and lower lows. They also went shortly below the lower limit of Bollinger band and came back up. Everything looks like business as usual, no reason to panic.
---
### Author:  [@Dr.PI](https://forum.mustachianpost.com/u/Dr.PI)
#### Post date: [March 26, 2023, 7:02am UTC](https://forum.mustachianpost.com/t/benchmarking-the-market/15991/9 "2023-03-26T07:02:04Z")
> [@kraphael](#):
>
> i think we might see a 6,5% retracement (to 1590 CHF according to your calculations) before we bounce, there is quite big support level there
I would say this is quite correct, congratulations!
---
### Author:  [@Dr.PI](https://forum.mustachianpost.com/u/Dr.PI)
#### Post date: [June 24, 2023, 8:56am UTC](https://forum.mustachianpost.com/t/benchmarking-the-market/15991/10 "2023-06-24T08:56:01Z")
There were some ups and downs after
> [@Dr.PI](#):
>
> 13.3.2023: 1574.97 CHF, -19.1% from ATH, +3.5% from the 30.09.2022 bottom, 0.2% YTD, -7.7% from the previous pivot.
But nothing interesting until very recently we had got a new high after the 30.09.2022 bottom:
13.6.2023: 1727.88 CHF, -11.3% from ATH, +13.5% from the 30.09.2022 bottom, 9.9% YTD.
Yesterday’s value is already 2% lower. I expect the markets to pull back next 2-3 weeks and end up 5-6% below the last high (lower limit of the Bollinger bands of VT in CHF, TradingView).
---
### Author:  [@Dr.PI](https://forum.mustachianpost.com/u/Dr.PI)
#### Post date: [August 15, 2023, 5:34am UTC](https://forum.mustachianpost.com/t/benchmarking-the-market/15991/11 "2023-08-15T05:34:14Z")
> [@Dr.PI](#):
>
> Yesterday’s value is already 2% lower. I expect the markets to pull back next 2-3 weeks and end up 5-6% below the last high (lower limit of the Bollinger bands of VT in CHF, TradingView).
You can obviously through away my forecast. VT in CHF haven’t gone lower than the minimum on 23.06 and higher than the maximum on 15.06. And now we are again closer to the lower limit of this 4-5% wide range.
---
### Author:  [@Dr.PI](https://forum.mustachianpost.com/u/Dr.PI)
#### Post date: [September 2, 2023, 7:53am UTC](https://forum.mustachianpost.com/t/benchmarking-the-market/15991/12 "2023-09-02T07:53:52Z")
Ok it feels like back to school, so time for some recapitulation.
The index that I am looking at is "MSCI ACWI IMI Net total Return in CHF” as calculated by MSCI.
Some key pivots from 2023:
28.12.2022: 1561.78 CHF, -19.8% from ATH, +2.6% from the 30.09.2022 bottom.
30.12.2022: 1571.63 CHF, -19.3% from ATH, +3.3% from the 30.09.2022 bottom.
02.01.2023: 1574.09 CHF, -19.2% from ATH, +3.4% from the 30.09.2022 bottom, 0.2% YTD.
Januar 2nd, when the index was calculate first time for the year, remains the lowest value for 2023! I am impressed!
We have missed it by a hair during the banking crisis:
13.3.2023: 1574.97 CHF, -19.1% from ATH, +3.5% from the 30.09.2022 bottom, 0.2% YTD.
Afterwards the index was doing more or less consistently higher highs and higher lows. This is a very encouraging trend!
Meanwhile we had a new maximum for 2023:
1.08.2023: 1738.95 CHF, -10.7% from ATH, +14.2% from the 30.09.2022 bottom, 10.6% YTD.
Special congratulations to all calculating your assets in CHF!
After that, there was a healthy pull back:
17.08.2023: 1658.48 CHF, -14.9% from ATH, +9% from the 30.09.2022 bottom, 5.5% YTD, -4.6% from the previous maximum.
Even now the index is at 1718.71 CHF for yesterday, which is very close to the maximum for 2023.
Everything is going great!
Stay tuned for more market news in a month or so!
---
### Author:  [@Wolverine](https://forum.mustachianpost.com/u/Wolverine)
#### Post date: [September 2, 2023, 8:00am UTC](https://forum.mustachianpost.com/t/benchmarking-the-market/15991/13 "2023-09-02T08:00:49Z")
Thanks for the inputs. I must have missed it upthread but what index are you referring to?
**Edit:** thanks!
---
### Author:  [@Dr.PI](https://forum.mustachianpost.com/u/Dr.PI)
#### Post date: [November 4, 2023, 10:56am UTC](https://forum.mustachianpost.com/t/benchmarking-the-market/15991/14 "2023-11-04T10:56:34Z")
Ok now it feels again like a time to sum up few things.
The index that I am looking at is "MSCI ACWI IMI Net total Return in CHF” as calculated by MSCI.
Some key pivots from 2023:
28.12.2022: 1561.78 CHF, -19.8% from ATH, +2.6% from the 30.09.2022 bottom.
30.12.2022: 1571.63 CHF, -19.3% from ATH, +3.3% from the 30.09.2022 bottom.
02.01.2023: 1574.09 CHF, -19.2% from ATH, +3.4% from the 30.09.2022 bottom, 0.2% YTD.
Banking crisis:
13.3.2023: 1574.97 CHF, -19.1% from ATH, +3.5% from the 30.09.2022 bottom, 0.2% YTD.
Maximum for 2023:
1.08.2023: 1738.95 CHF, -10.7% from ATH, +14.2% from the 30.09.2022 bottom, 10.6% YTD.
October minimum:
26.10.2023: 1599.01 CHF, -17.9% from ATH, +5.1% from the 30.09.2022 bottom, 1.7% YTD.
We went down to levels last seen in March, but not lower.
Now:
3.11.2023: 1681.7 CHF, -13.7% from ATH, +10.5% from the 30.09.2022 bottom, 7% YTD.
The recovery from the October minimum was incredibly rapid. +5.2% in 6 trading days, retracing 60% of the distance between October minimum and the maximum for 2023.
I wonder if the mood will change to the positive and there will be a Christmas rally after all.
---
### Author:  [@Dr.PI](https://forum.mustachianpost.com/u/Dr.PI)
#### Post date: [November 11, 2023, 8:27am UTC](https://forum.mustachianpost.com/t/benchmarking-the-market/15991/15 "2023-11-11T08:27:45Z")
> [@Dr.PI](#):
>
> The index that I am looking at is "MSCI ACWI IMI Net total Return in CHF” as calculated by MSCI.
>
> Maximum for 2023:
> 1.08.2023: 1738.95 CHF, -10.7% from ATH, +14.2% from the 30.09.2022 bottom, 10.6% YTD.
>
> October minimum:
> 26.10.2023: 1599.01 CHF, -17.9% from ATH, +5.1% from the 30.09.2022 bottom, 1.7% YTD.
> We went down to levels last seen in March, but not lower.
Now:
10.11.2023: 1696.01 CHF, -12.9% from ATH, +11.4% from the 30.09.2022 bottom, 7.9% YTD.
The recovery from the October minimum continues rather fast. +6.1% in 11 trading days, retracing 69% of the distance beween October minimum and the maximum for 2023. 🧐 Add +2.6% from the current level and we are at a new 2023 maximum.
---
### Author:  [@wavemotion](https://forum.mustachianpost.com/u/wavemotion)
#### Post date: [November 16, 2023, 10:38am UTC](https://forum.mustachianpost.com/t/benchmarking-the-market/15991/16 "2023-11-16T10:38:46Z")
This last rally was already quite remarkable
---
### Author:  [@Dr.PI](https://forum.mustachianpost.com/u/Dr.PI)
#### Post date: [November 22, 2023, 7:04am UTC](https://forum.mustachianpost.com/t/benchmarking-the-market/15991/17 "2023-11-22T07:04:17Z")
> The S&P 500 staged the kind of comeback that only comes around every half a century.
> The benchmark index’s higher close yesterday pulled it out of correction territory, closing at its highest level since early August. A correction is typically defined as a 10% drop from the recent high.
> The rebound took just 16 sessions, the shortest turnaround time since the 1970s, according to data from Dow Jones
> In the near term, though, Citi’s quant team says more gains could be ahead due to a short squeeze
> “The pace of the recovery has been rapid and appears to have caught many short holders off-guard, leaving a large amount of legacy short positions in loss," Cit’s head of quant Chris Montagu said.
> “Average short losses for Nasdaq are slightly larger at 5.6%, whereas average S&P 500 short position losses are near 4.3%. Both are considerable, and a further rally could lead to increased forced covers and lend near-term support to markets.”
My benchmark’s “MSCI ACWI IMI Net total Return in CHF” pull back from 2023 maximum to October minimum was -8%, though.
The latest maximum still misses a bit for a new 2023 high.
---
### Author:  [@Dr.PI](https://forum.mustachianpost.com/u/Dr.PI)
#### Post date: [December 9, 2023, 4:02pm UTC](https://forum.mustachianpost.com/t/benchmarking-the-market/15991/18 "2023-12-09T16:02:51Z")
The index that I am looking at is "MSCI ACWI IMI Net total Return in CHF” as calculated by MSCI.
We have just got a new maximum for 2023:
08.12.2023: 1739.28 CHF, -10.7% from ATH, +14.3% from the 30.09.2022 bottom, 10.7% YTD.
However, this is exactly the “resistance” range where the index was reverted already 4 times this year, peaking at
13.06.2023: 1727.88 CHF
04.07.2024: 1730.35 CHF
01.08.2023: 1738.95 CHF
14.09.2023: 1732.43 CHF
It would be nice if it gets over some previous peaks:
16.08.2022: 1748.16 CHF
07.06.2022: 1769.75 CHF
Well, we can be there after one very positive day…
---
### Author:  [@Dr.PI](https://forum.mustachianpost.com/u/Dr.PI)
#### Post date: [January 27, 2024, 8:40am UTC](https://forum.mustachianpost.com/t/benchmarking-the-market/15991/19 "2024-01-27T08:40:11Z")
I went back to analyze the development of my benchmark, "MSCI ACWI IMI Net Total Return in CHF” as calculated by MSCI, adjusted for CHF inflation as outlined here:
> [@Statistics, black magic and financial mathematics](https://forum.mustachianpost.com/t/statistics-black-magic-and-financial-mathematics/6229/18):
>
> I have thoughts about the benchmarking of the stocks market recently, will dump here some notes. To adjust for inflation in Switzerland, I use these data: Landesindex der Konsumentenpreise (LIK): In the table view, the data can be exported as CSV. I define the inflation-adjusted index as the index’s value in CHF divided by LIK value for the previous month. Depending on the time frame, I will use different reference dates for LIK. The result should reflect the purchasing power of a unit of…
From now on, I will also comment on benchmark changes taking into account the change of purchasing power.
The inflation adjustment didn’t change much for Corona crash. It was fast and not accompanied by a surge of inflation.
The growth of the benchmark from the bottom of the Corona dip (23.03.2020) to the most recent all-times-high (16.11.2021) was 94.9% nominal CHF and 93.1% infl.adj. The inflation effect is bearable, I would say.
After that, it is very impressive to see how inflation changes the real return of the stocks market - always to the worse.
I previously defined a ‘Bear Market’ regime when the index drops more than 20% from the ATH.
> [@Statistics, black magic and financial mathematics](https://forum.mustachianpost.com/t/statistics-black-magic-and-financial-mathematics/6229/19):
>
> To classify the state of the stock market, as quantified by a specific index, I am going to consider these three regimes: Normal State: The market is classified as in a ‘Normal State’ when the market index is less than 10% below its all-time high (ATH). Correction: The market enters a ‘Correction’ phase when the index is between 10% and 20% below the ATH. Bear Market: The market is in a ‘Bear Market’ regime when the index drops more than 20% from the ATH. These regimes can be utilize…
In nominal terms, in 2022-2023, there was only one occasion when my benchmark went into this zone, with a minimum on 30.09.2022 (-21.9 % in nominal CHF). On inflation-adjusted basis, there were 6 occasion when the benchmark dived into a ‘Bear Market’ zone, with the following minima:
20.06.2022: -21.1%
30.09.2022: -24.2%
28.12.2022: -22.1%
13.03.2023: -22.3%
04.05.2023: -21.1%
26.10.2023: -21.5%
Spooky.
On a positive note, the rally that have started from the 26.10.2023 bottom had a consolidation phase from mid-December to mid-January. Now this rally have just finished its third month, and no correction are in sight (they are coming unexpected, anyway).
The latest maximum was on 25.01.2024, 1802.2 CHF nominal. This is a level not seen from May 2022.
On a nominal basis, it is -7.5% from ATH, +18.4% from the 30.09.2022 bottom, 3.7% YTD.
However on an inflation-adjusted basis, it is -11.5% from ATH, +16.9% from the 30.09.2022 bottom, 3.7% YTD.
Therefore, we have not gotten out of the correction regime.
---
### Author:  [@Dr.PI](https://forum.mustachianpost.com/u/Dr.PI)
#### Post date: [January 27, 2024, 8:45am UTC](https://forum.mustachianpost.com/t/benchmarking-the-market/15991/20 "2024-01-27T08:45:34Z")
P.S. Before you ask:
The return of the same benchmark for 2023 was +10.6% in nominal CHF and +9.0% in inflation-adjusted CHF. 1.6 percent points have been eaten by the inflation.
[Next page](https://forum.mustachianpost.com/t/benchmarking-the-market/15991.md?page=2)