It shows the quintiles already for each group!
2 Likes

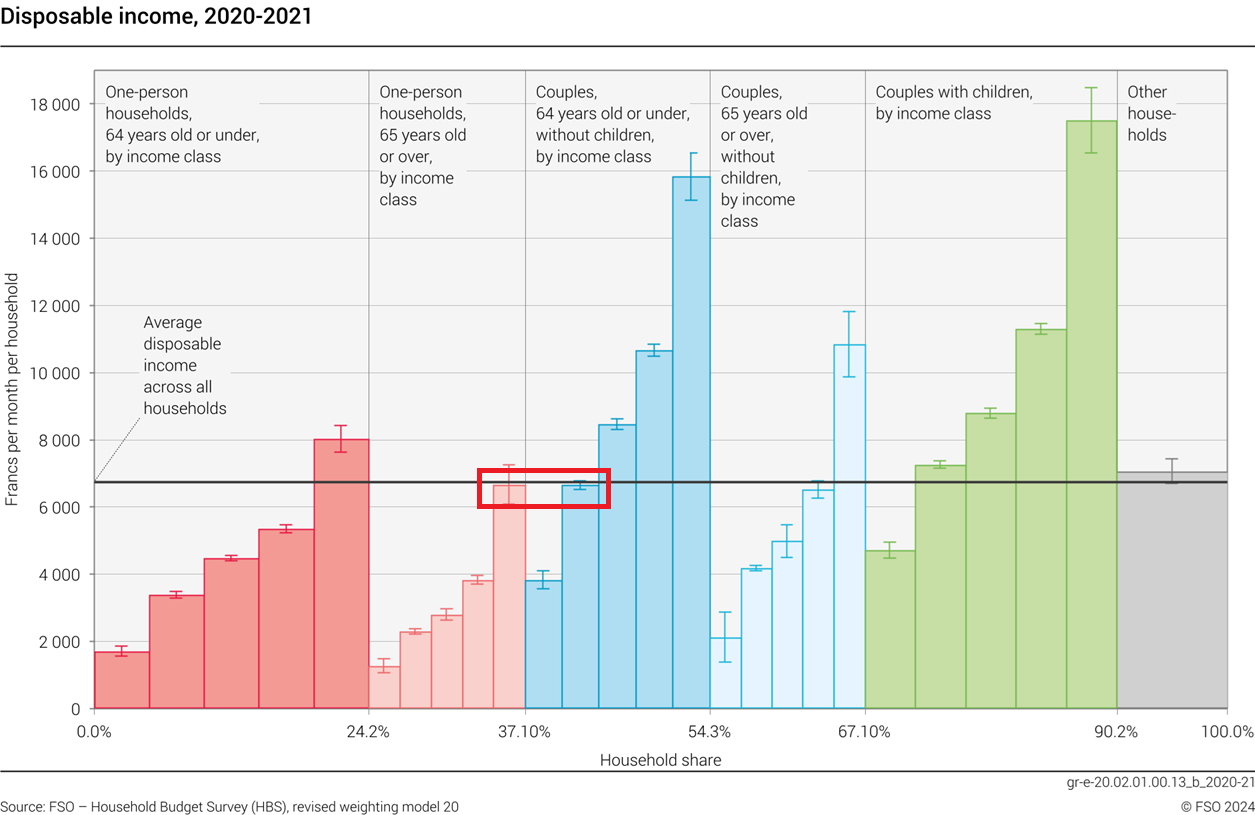
Come on, the x axis is litterally named “household share”. The categories are organized by quintiles (granted, that doesn’t give you access to an accurate median but the median is as arbitrary as, say, the 20%, 40%, 60%, 80% or 100% bottom share of households and you can approximate it somewhere between the top of the second and third columns of each category) and the global one can be obtained by reordering the columns from least to most disposable income and looking at the first one to cross the 50% of households thresholds (after a quick check, it’s really almost identical to the average one).
Edit: took too much time writing my post and got beat by @PhilMongoose
1 Like
Yes, see my reply above.
You don’t calculate it, you plot it. ![]() And as stated in my post, the difference with the average is really insignificant.
And as stated in my post, the difference with the average is really insignificant.
Edit: you are somewhere between the tops of these two columns, so slightly lower than the average:
2 Likes
Are you one of those math … degrees unemployable but at the Federal Bureau of Statistics?
I’ll see myself out.
I suppose you can guesstimate it by taking the mid point of the 2nd and third quintile. Eyeballing it, I’d say 96k. (EDIT: this is for “couples with children”, which is what I thought goofy was asking for, but it seems he might have been asking for the global median).
1 Like
Hallelujah. Fields medalist candidate identified.
Thanks to everyone else playing along proving the point?
![]()
Now you’re making OP definitely feel bad about himself.
Anyway, among expenses check taxes, then be aware of some invisible risks.
1 Like
Ah, apologies again. I misunderstood the purpose of this topic evolution to demonstrate to the OP that maybe there are reflections to be had.
No chastizing on my behalf, just asking questions whether one is within, below, or above the fold.
3 Likes
Forgot to answer to the OP and my apologies for that (and for the digression, I just couldn’t help myself. Plots are shiny).
I would say life is expensive. The people I talk with, some of them having had good level of income (not megacorp software engineer level but comfortably over the median), raising children puts a strain on finances and gives this impression of never being in a comfortable position.
As pointed out by @Luk_nuts, your household income has actually gone down in recent years, so it isn’t just an impression that things have become tougher, they have in actuality.
I would say that taxes, at least, should not come as a surprise and should be provisioned beforehand so, as pointed out by others, I’d want to know at least my bigger plannable expenses in advance so as to put money aside for them.
On the point of taxes, as a business owner, it’s possible/likely that there are a good range of expenses that you could deduct as business expenses. If you haven’t already, it may be worth digging on that topic.
I can’t support enough @Dr.PI’s statement and advice. I’d just add to that that when it comes to tracking expenses, as with many other things in life, doing something is better than doing nothing, that is, if you can’t track everything accurately, at least having some data that you can complete with estimations on the broader categories should help (you may miss a month sometimes and/or have incomplete data, it’s not optimal but not critical, what’s important is to do our best to know where our money is going, not to have a perfect track of it).
The bare minimum I do is to take note of my monthly income, the evolution of my net worth, potential investment gains/losses (that should either be counted as (negative) income or discounted) and get the global amount of expenses I’ve incurred that month from that. If it differs significantly from the other months, I then try to evaluate what happend and what those special expenses were and write it down.
2 Likes
Usually, for this kind of thing, the super high earners at the top (and maybe the super poor at the bottom) distort the numbers. Looking at this dataset, you see clearly the top quintile is very high (and it spills over to the 4th quintile). The first quintiles is also a bit low.
But once you stripped out the top and bottom quintiles, the rest are better behaved and the 2nd and 3rd quintiles are probably the most smooth, so quite safe to interpolate between the two.
1 Like
Not even 2 millions a year? Where are the statistics?
Nothing here makes me feel bad, I opened the thread with the intention to get some advice, as this forum has been a goldmine for me personally for finances and stock market.
While in reality the income has become smaller, on the other hand our kindergarden/school fees are getting near the end, one of my kids is already independent and we pay nothing for childcare but on the other hand now there are sport camps, activities, ski, switch 2 OLED and whatnot so it adds up again, not like before though!
So all in we should be more or less at the same level of disposable income at this moment.
Regarding the car, I average between 80 and 120k km per year, from all the calculations I have made the sweet spot for me is to buy it second hand between 3 and 5 years old, between 80k and 120k kms, and drive it to 350-450k km. After this point, putting it through the inspection can be very tricky and expensive. But it is no issue to sell it as export for few thousand depending on the model.
3 Likes
Switch 2 has not been released with an OLED screen. Yet. Start saving.
That’s a huge expense item, is it work related ? (So should be offset in taxes). If not, it may be related to a considerable amount of leisure time -and spending. Which is great, but might explain saving issues.
What’s your level of confidence about taxes?
2 Likes
Very interesting thread here! @rew342343 I’ll attach my budget sheet here, hope it helps. The most important thing is do ‘Dig Deep‘. If you have large positions in a single category, try to subdivide it.
If anyone has suggestions to improve it, please let me know! https://docs.google.com/spreadsheets/d/1DzcJmskeWpwypFlI3lzAjAXp1qHjRW1TXH2oTm3Sbr4/edit?gid=814013255#gid=814013255
Is a good friend: Cookie Not accepted
1 Like
To improve the spreadsheet or your spending?
For the latter, 400 a month for eating out, 833 a month for holidays and 200 a month for clothes is quite a lot. But I don’t have any clue. Is this budget for a single person?
Both actually!
Good catch, it’s a 2 person, single income household.
So you spend 1’200 a month on food and another 150 for lunch at work, that seems extremly high to me for 2 persons. My parents used to spend around 800-900 for 5 persons.
200 a month for clothes is also way too high. Personally I barely spend any money on clothes and when I do, I normally buy high-quality stuff that lasts me for 5-10 years.
And 10’000 a year on holidays is heavy and certainly a position to optimize. Travel off season, more local holidays like hiking or biking (could also save on gym costs ![]() ).
).
Btw, that’s just my opinion, no offense ![]()
And OP, sorry for hijacking the thread.
1 Like